zactrack Web Monitor
The “Web Monitor” is a browser-based interface for monitoring the entire zactrack system. It includes Live View for real-time data, a Diagnostics tab, and access to features like system reports, maintenance, updates, the manual, proxy control, and tablet app downloads.
The Web Monitor is a powerful tool to monitor the zactrack system.
Use the IP address of the server in any browser to access the web user interface.
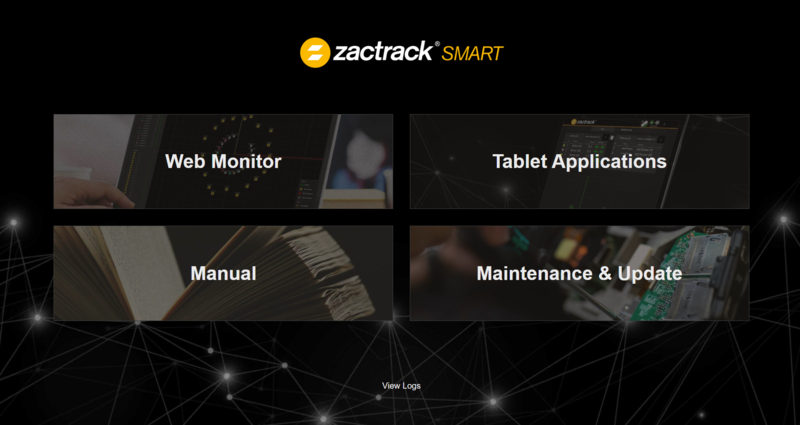 |
Web Monitor
Tool for monitoring the whole zactrack system, and creating reports.
Tablet Applications
Download area for the Tablet Applications to use with an Android device.
Manual
Enter the manual page
Maintenance & Update
Enter for updating and Factory Reset. See Software Update for more information.
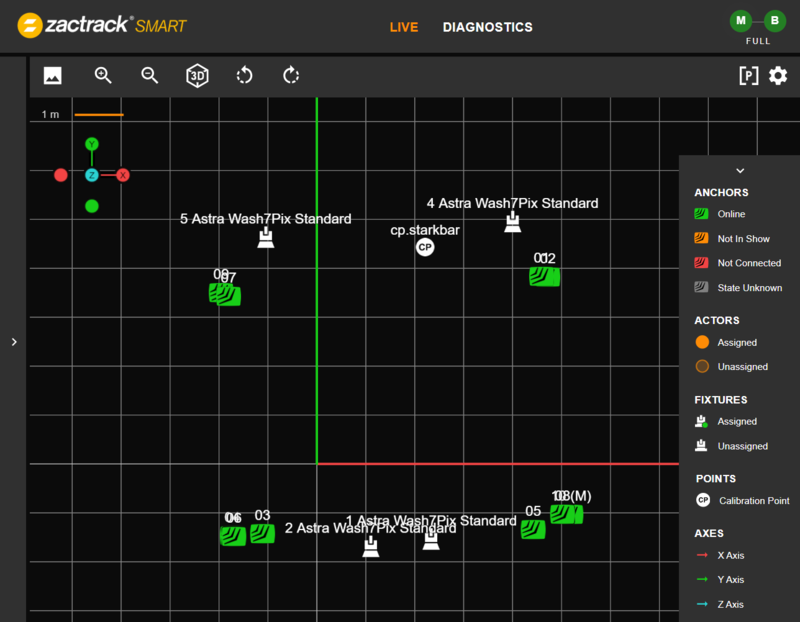
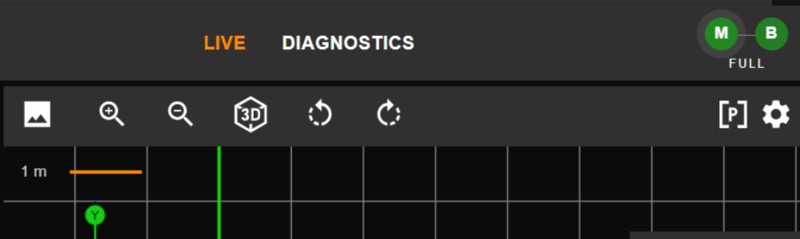
The Web Monitor's first section is the Live View. This area contains live position information, status, battery levels and the stage view. The view looks similar to the Live Tab in the zactrack App.
 |
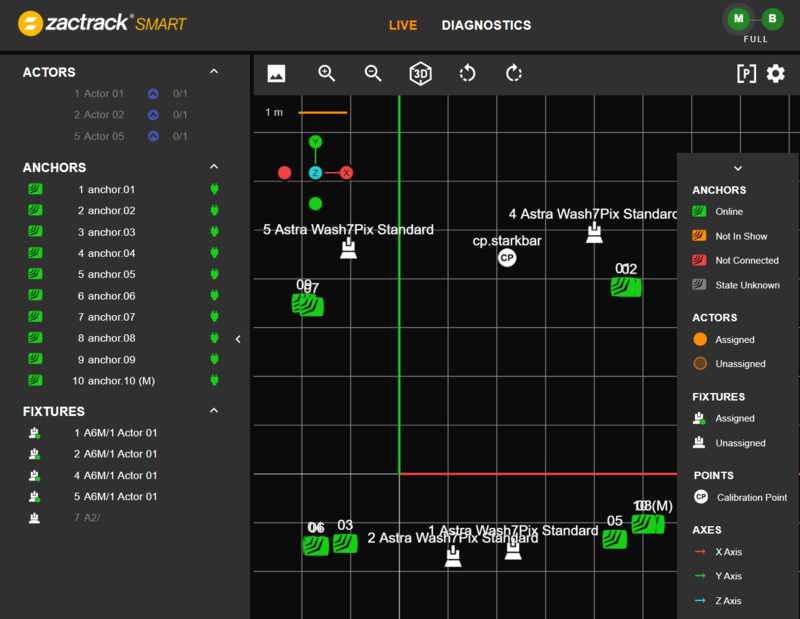
Expand the left side to use all associated Actors, Anchors and Fixtures.
 |
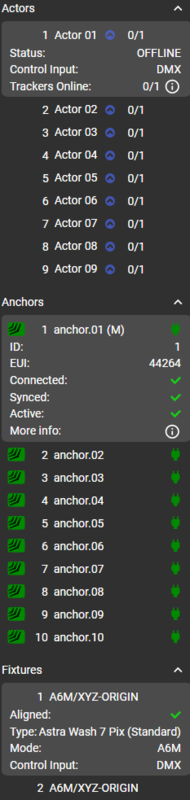
By clicking the device, more information becomes available.
 |
Tap the gear icon in the top right corner to change settings.
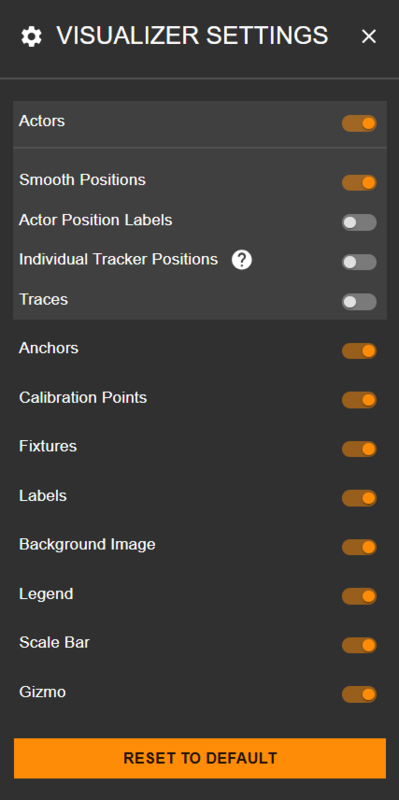 |
Actors
Activate and deactivate Actors View
Smooth Positions
It is possible to see the raw positions instead of the Smooth Position
Actor Position Labels
See the XYZ coordinates
Individual Tracker Positions
In case of merged Trackers, it is possible to show individual Positions
Traces
A Trace is the historic course of an Actor.
Anchors
Show Anchors
Calibration Points
Show Calibration Points
Fixtures
Show Fixtures
Labels
Show Labels
Background Image
Show an individual uploaded background image
Legend
Show the Legend
Scale Bar
Show a Scale Bar
Gizmo
Show a gizmo in the visualizer indicating the view axes. Clicking the axes rotates the view respectively.
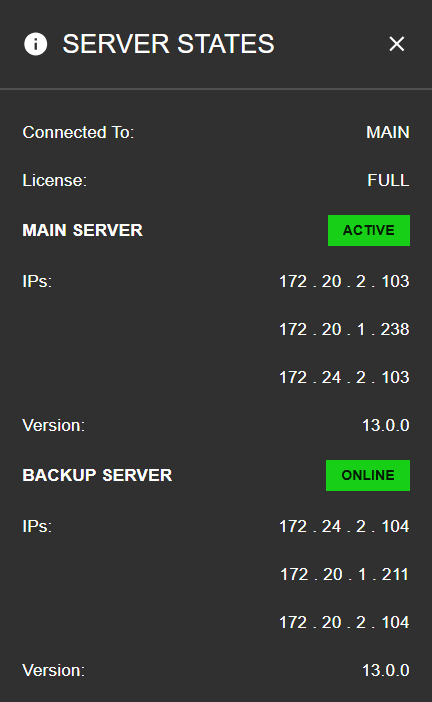
As in the App there is information about Main / Backup by pressing the Main / Backup icon in the top right corner.
 |
You can configure the Live View to your personal needs.
Background Image
Define a background image (e.g. a stage blueprint) for the view.
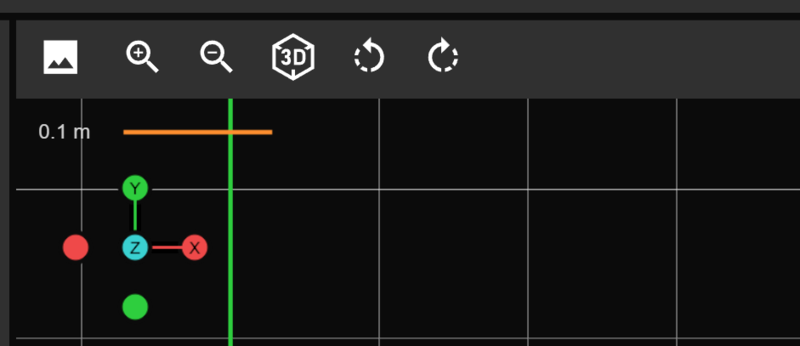
Zoom
Use the Plus and Minus buttons or the mouse wheel to zoom in and out.
2D/3D View
Switch between 2D and 3D view.
View Rotation
Rotate the 2D view clockwise/counter-clockwise.
Navigation Gizmo
Click on the colored axis ends to align the selected axis parallel to the camera's viewing axis.
The Proxy feature allows you to control virtual tracker positions (proxies) via mouse or touch input.
Click the [P] icon at the top right corner
Configure the Proxy to your needs.
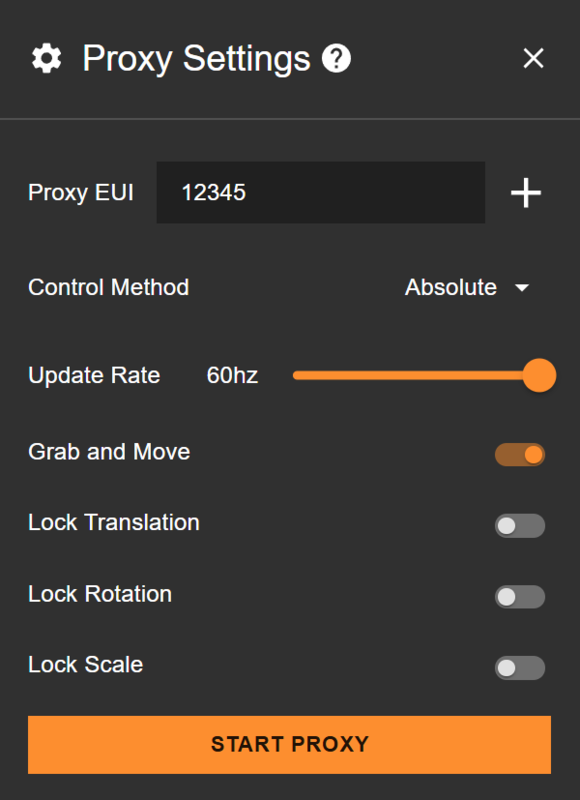
Proxy EUI
Define one or multiple EUIs for the position input, which also need to be defined in an Actor in order to use the virtual input.
Control Method
Switch between Absolute and Relative mode. In Absolute mode, the target will follow the exact mouse/touch input position. In relative mode, the target will match the relative movement of the mouse/touch input. Additionally, you can active the Follow mode, which moves the 2D view according to the input.
Update Rate
Define the update rate for position calculation.
Grab and Move
If this is active, the user needs to grab the Proxy first in order to move it. If inactive, any click on the 2D view will move the Proxy to the desired position.
Lock Translation / Rotation / Scale
Lock translation / rotation / scaling of the 2D while operating in Proxy mode.
After clicking the Start button, the user can operate the Proxy. Fixtures need to be assigned to an Actor containing the defined Proxy EUI.
Tip
You can control multiple Proxies simultaneously by working with multiple browser tabs or PC/mobile devices.
The second tab next to the Live view is the Diagnostics Tab.
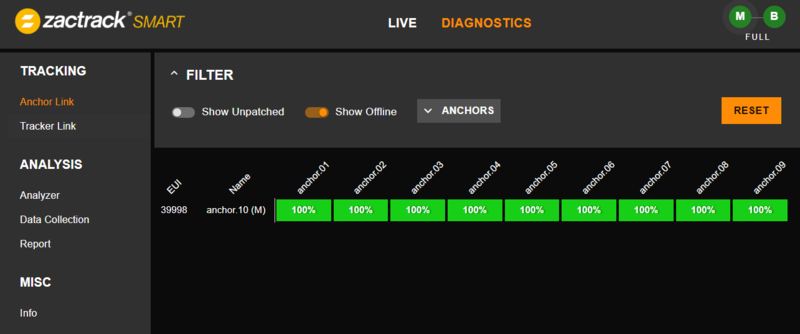
Anchor Link
The Anchor Link gives information about the connection between the Anchors.
Tracker Link
The Tracker Link shows information from each tracker to all Anchors.
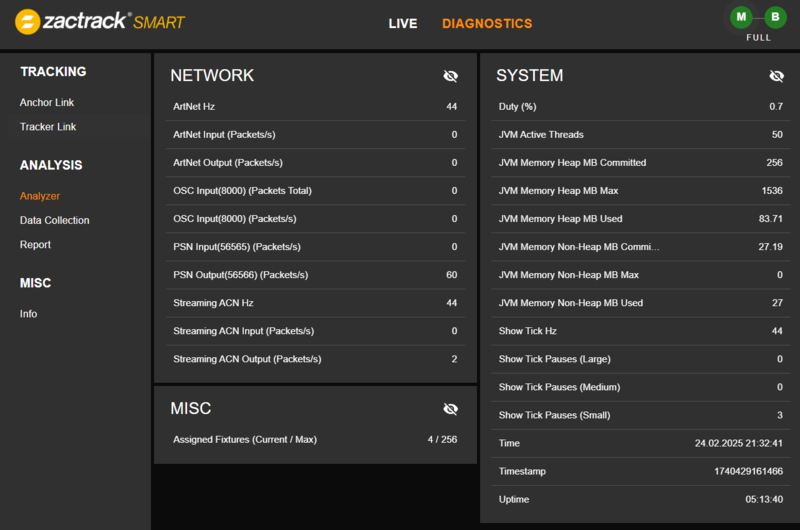
Analyzer
System information, refresh rates, system load
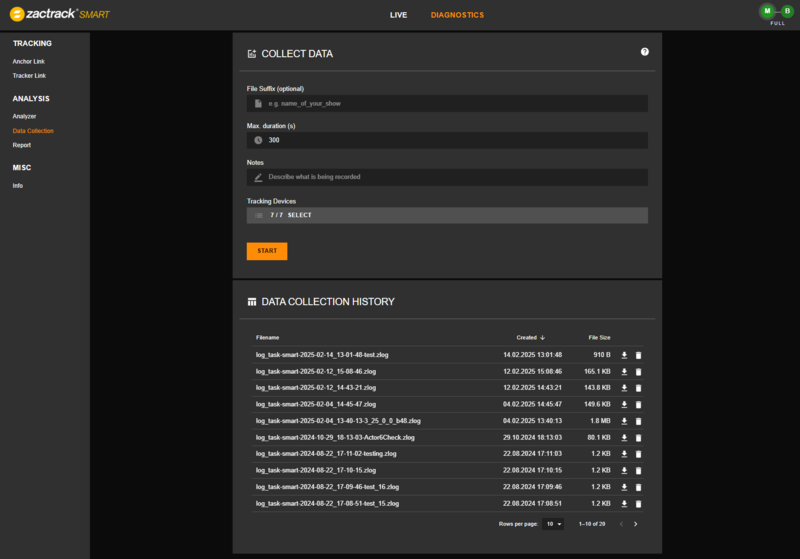
Data Collection
To create a position report it is necessary to first create a data collection. See PDF Report for more information.
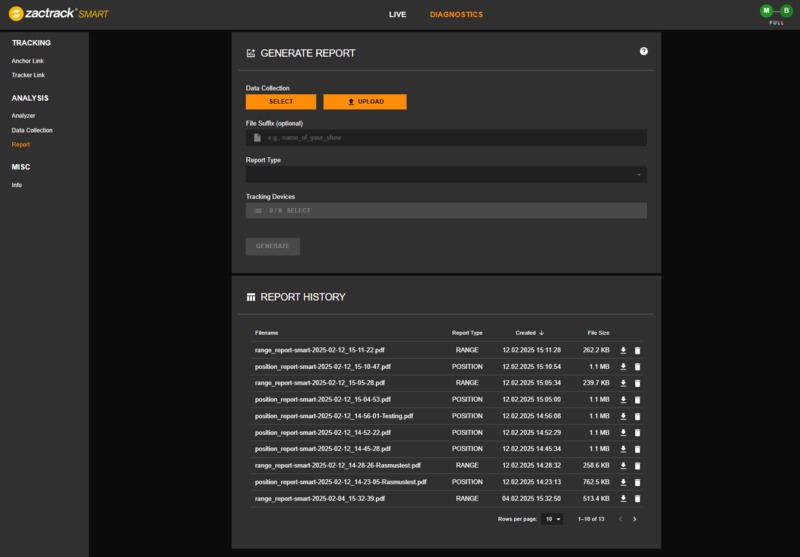
Reports
Generate a PDF Report. See PDF Report for more information.
Warning
Due to the workload, generating a report can cause tracking issues. Don't create a report during a show.
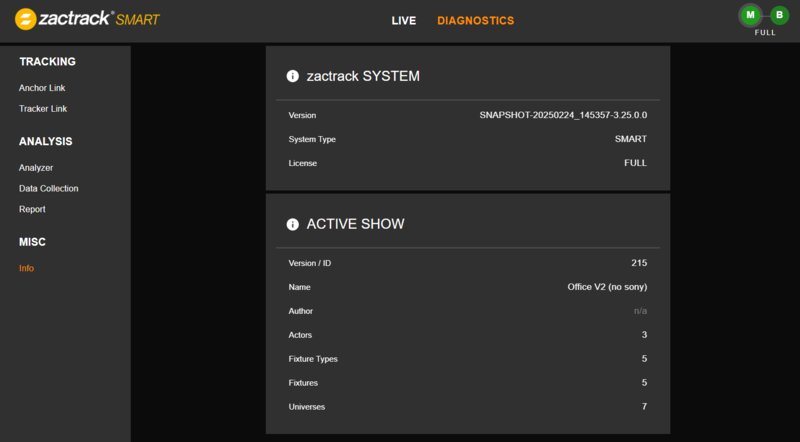
Info
Current version, License, Show Name, etc.
A good way for troubleshooting is creating a PDF Report. This report will collect a complete ranging profile of an Actor. With the generated PDF it is possible to get a better understanding of the system behaviour.
Note
A lot of experience is needed to understand such a report.
Generating a PDF Report
Access the Web Monitor via the IP address of the server in a browser.
Note
There are 2 possible Reports: Position Report or Range Report
Data Collection
PDF Generator
Here are some tips for data interpretation.
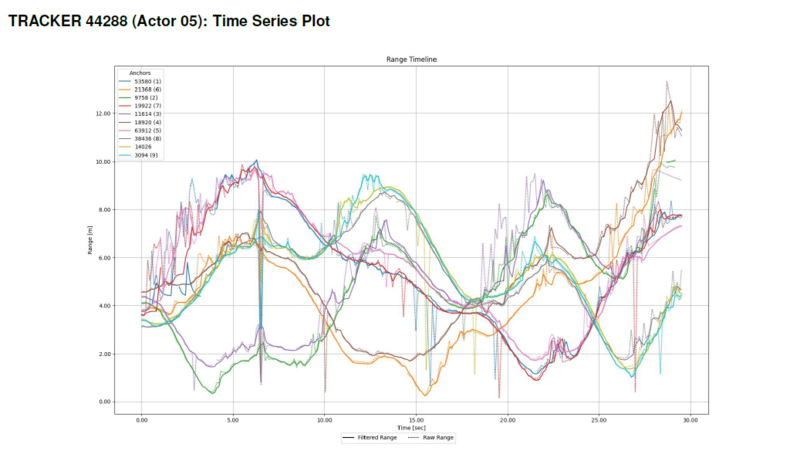
Range Report
A Range Report collects every single range from Anchor to Tracker. No Position is calculated. This Report helps to see single reflections of an Anchor.
Position Report
A position report creates a lot more data for analysis. See Position Report for more infomation.
This report is always for a single tracker. It is possible to select multiple trackers.
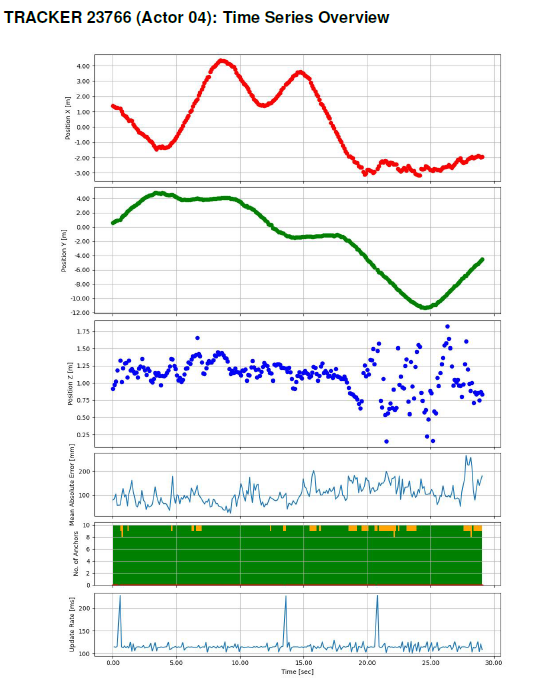
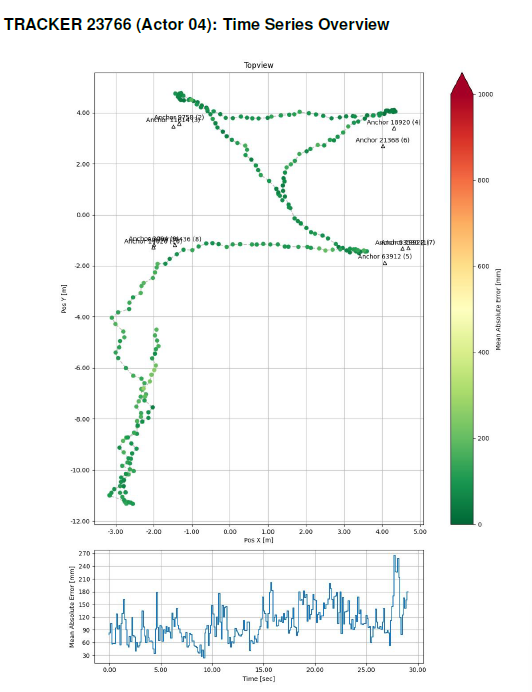
Time Series Overview
Time Series Overview has a complete split view of XYZ points. Single points without a course are an indication of bad resolution in an axis. The second diagram shows the complete Path with a Mean Absolute Error.
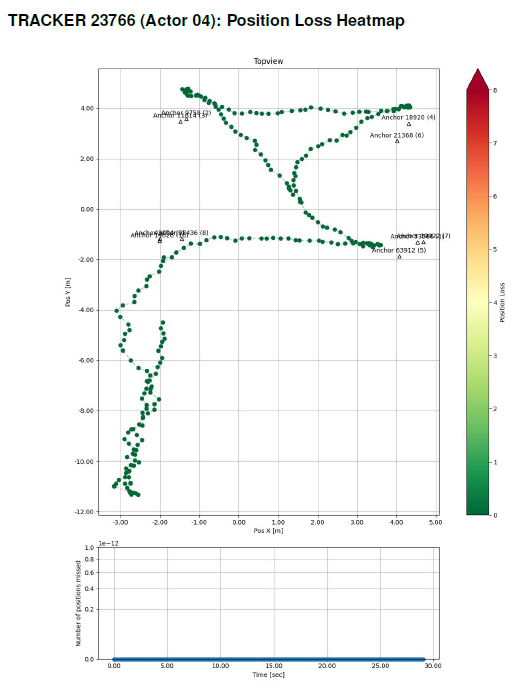
Position Loss Heatmap
This Map shows points with position losses.
Anchor Usage Heatmap
This map shows the used anchors at every single point.
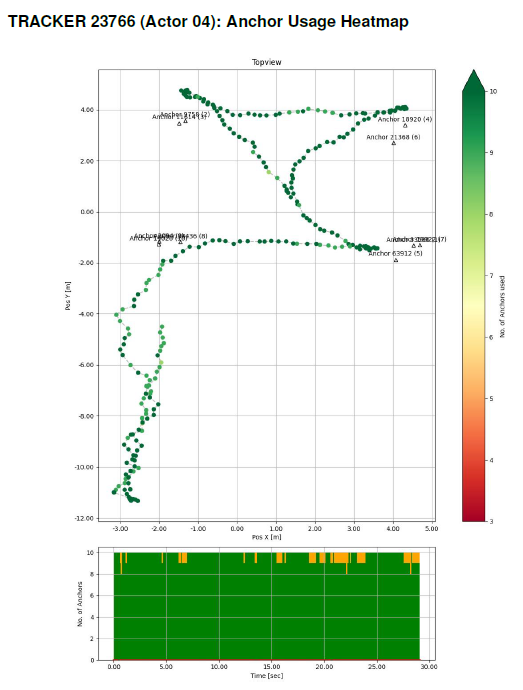
Note
In larger areas and due to the redundancy it is possible to not have all anchors at all points.
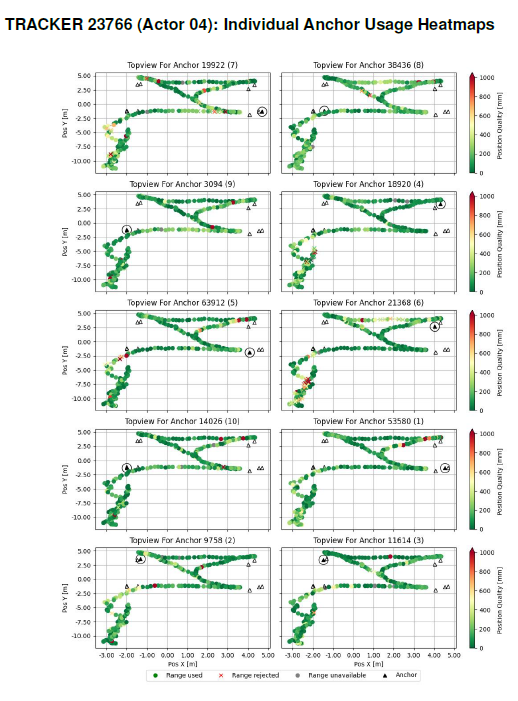
Individual Anchor Usage Heatmaps
This diagram shows a Position Quality Index for every single Anchor. The used Anchor is highlighted in the map.
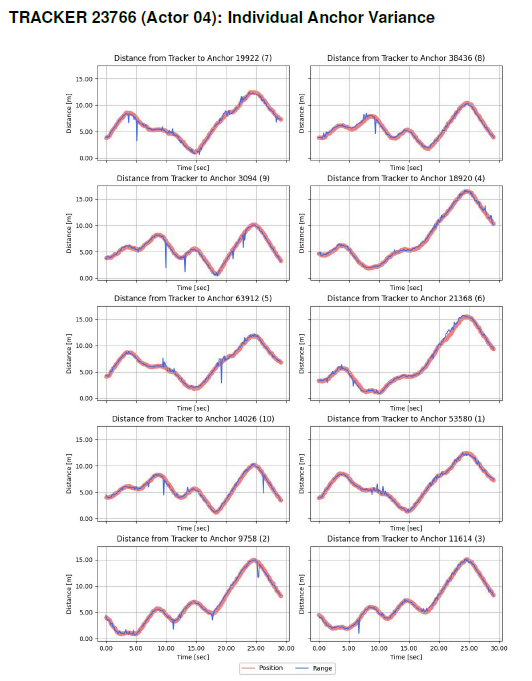
Individual Anchor Variance
This diagram shows the calculated position in red. A single range from one Anchor is shown in blue. Therefore every single Anchor has one Diagram.
Position Range Report Issue Examples
Here are some examples for obvious issues.
Individual Anchor Variance
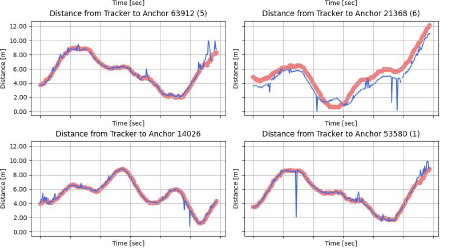
Here is an example of a wrongly measured Anchor. In the top right corner a picture of a shifted blue line is seen. The Anchor collects correct ranges but its own position is wrong. The spikes are reflections.
Individal Anchor Usage Heatmap
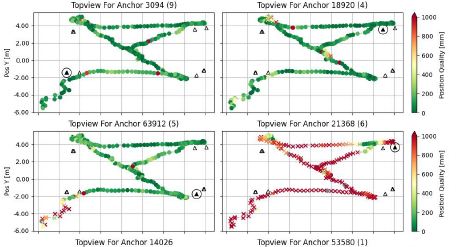
There is a problem with the Anchor in the bottom row at the right side. The position quality is noticeably bad. This can be a wrongly measured Anchor or a permanent reflection.
Time Series Overview
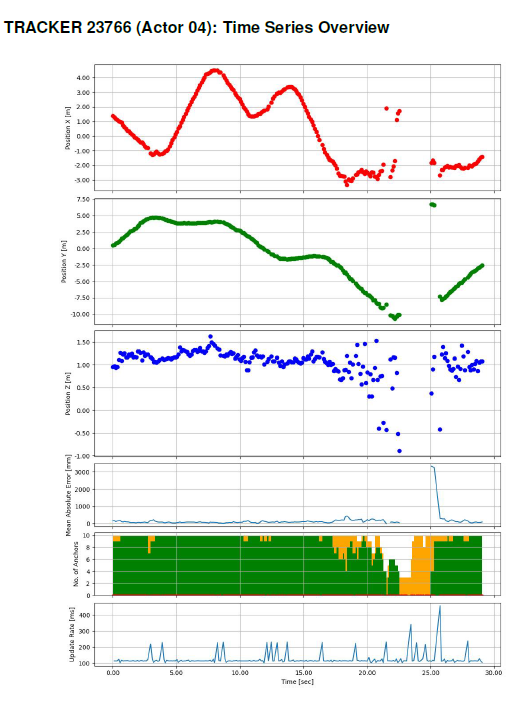
Complete position loss.