Diagnostics
The Diagnostics section offers multiple views to monitor the status of zactrack system components.
Tracking
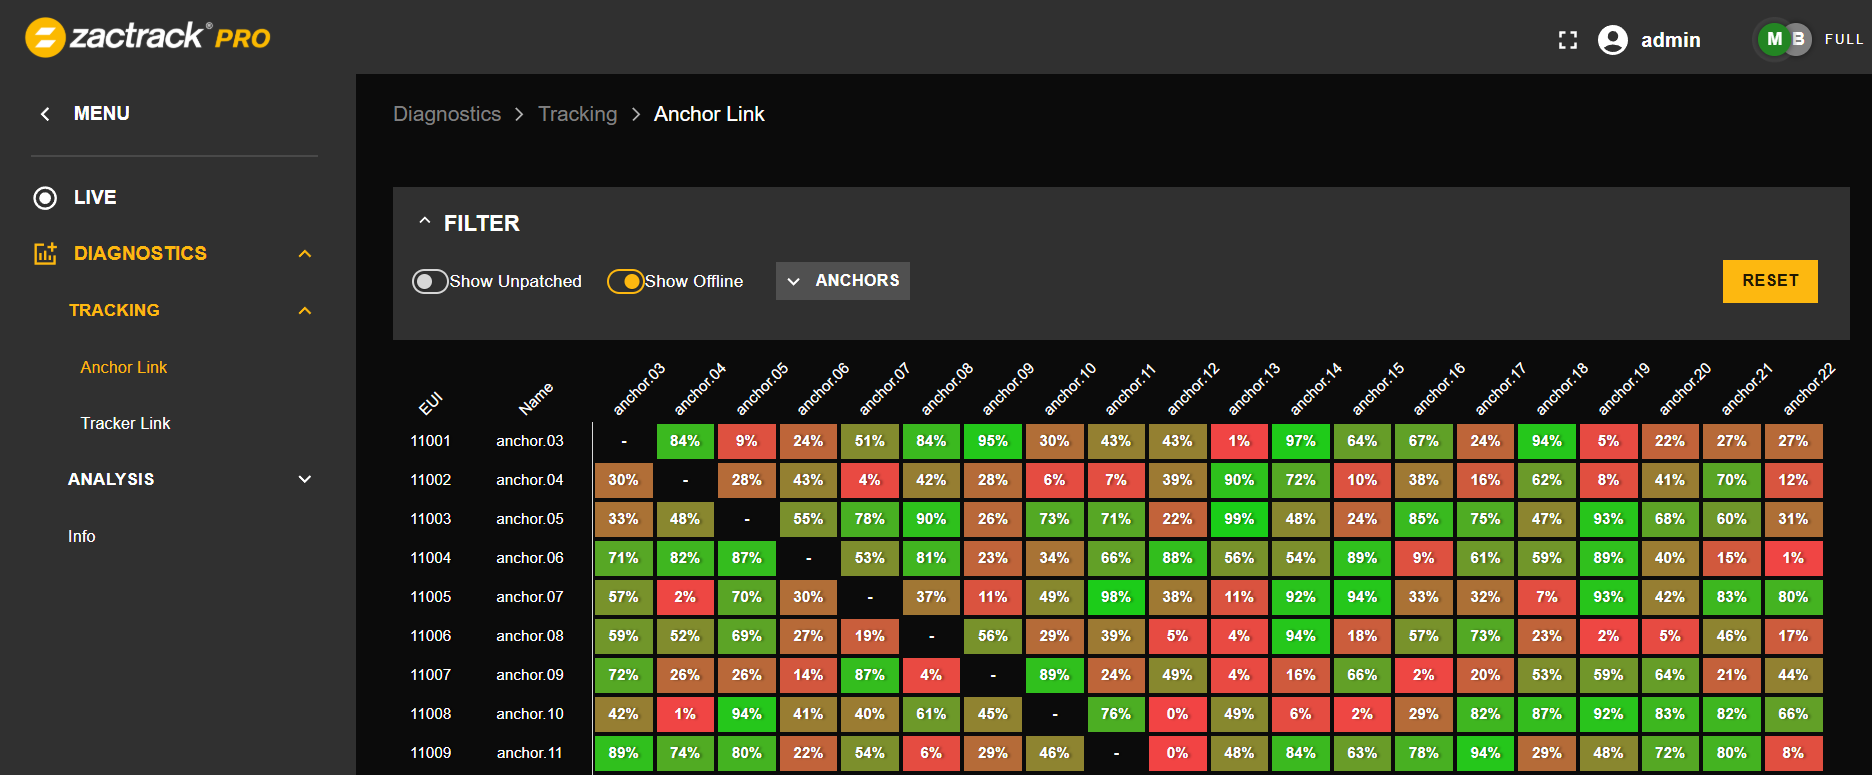
Anchor Link
The Anchor Link gives information about the connection between the Anchors. MINI and SMART systems only display the connection station of each Anchor to the Master Anchor. On PRO systems, the Anchor Link displays a full matrix showing the connection of each Anchor to every other.
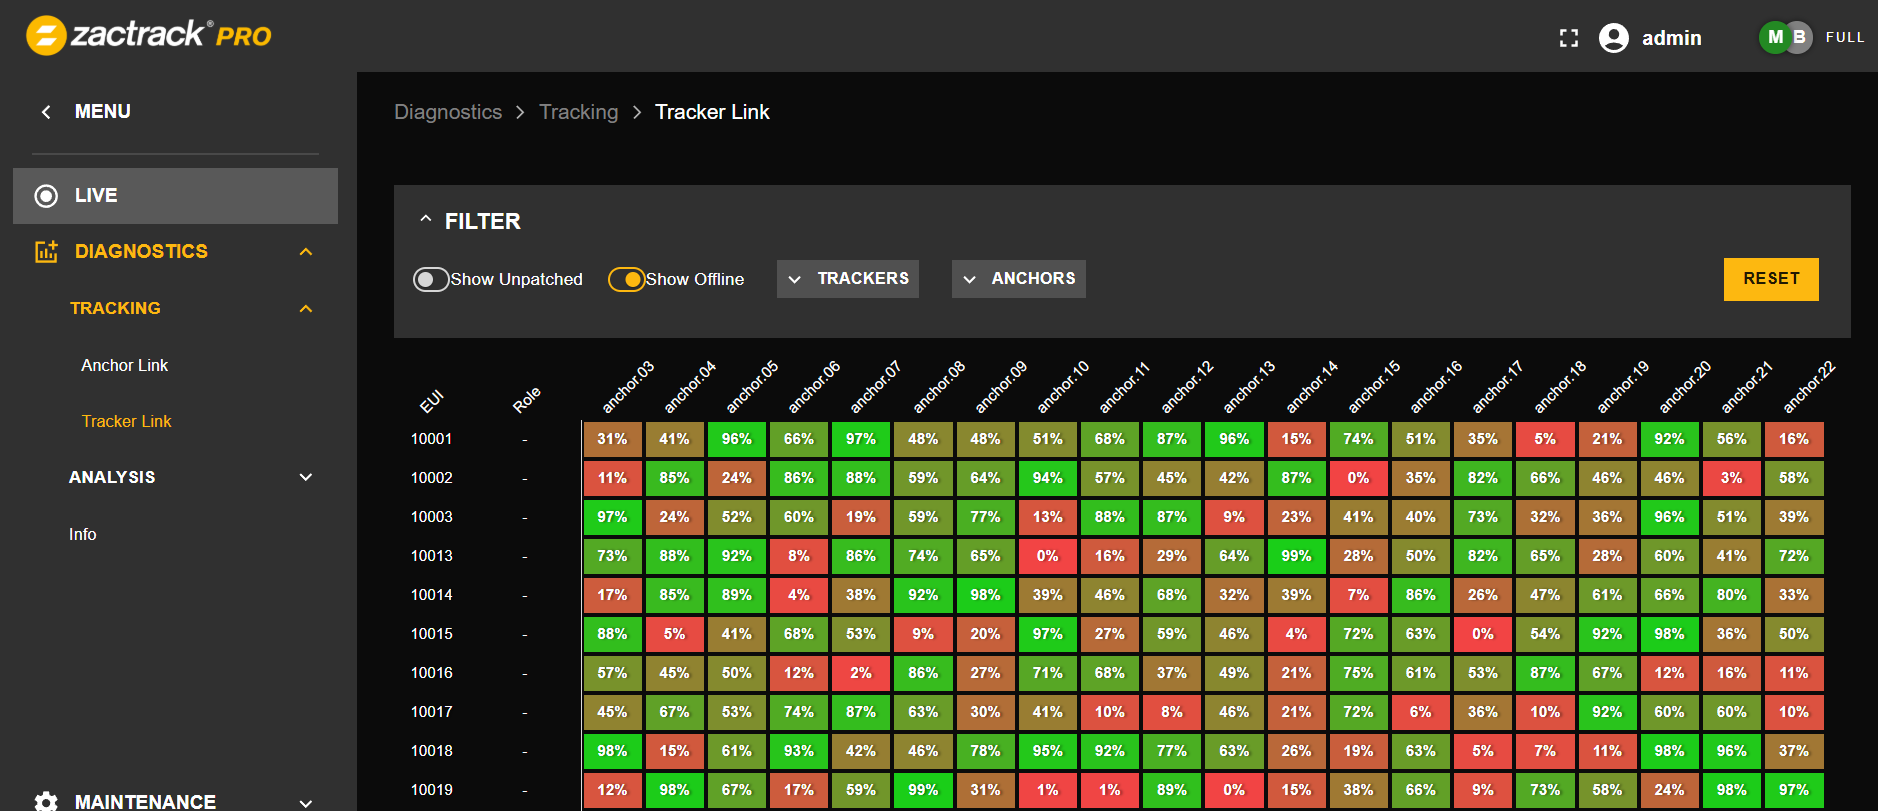
Tracker Link
The Tracker Link displays the signal strength for each Tracker to all Anchors.
Analysis
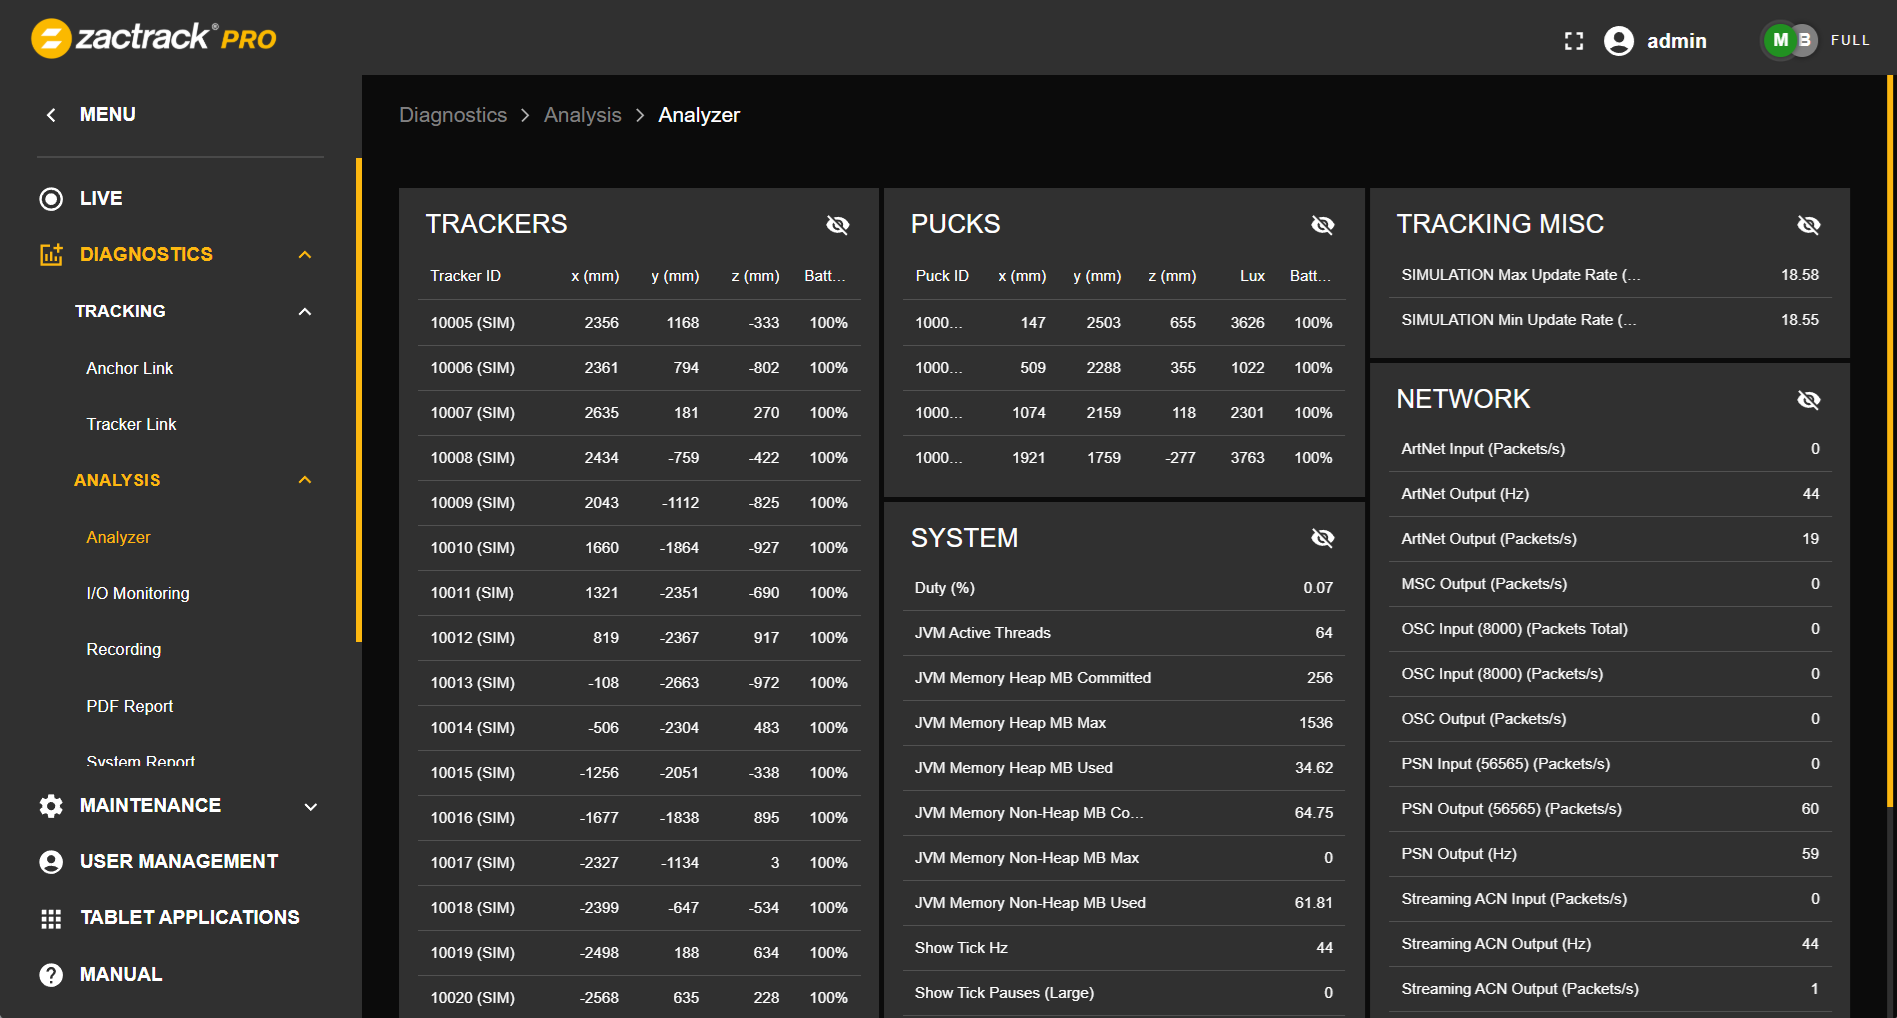
Analyzer
System information, refresh rates, system load and more information.
I/O Monitoring
Monitors in- and outgoing data traffic on the server. See I/O Monitoring for more information.
Recording & PDF Record
Record tracking data and generate PDF reports. See PDF Report for more information.
Warning
Due to the workload, generating a report can cause tracking issues. Don't create a report during a show.
System Report
Collect the current system state together with log files. This is the same functionality as on the App, see Advanced Settings
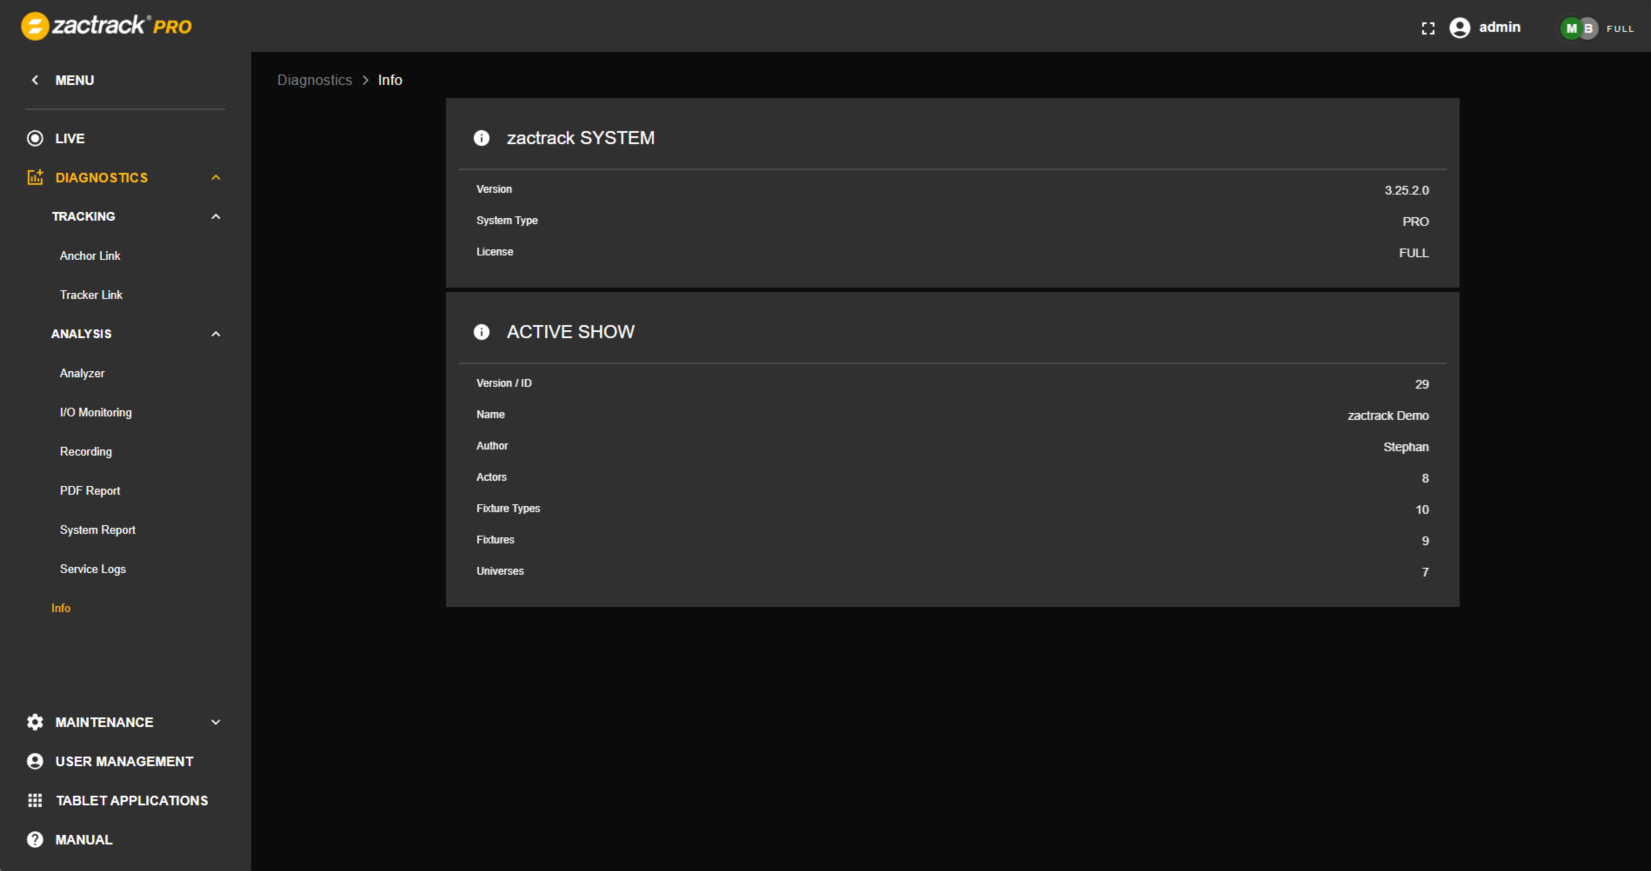
Info
Display current version, license, show name and more information.
 |
A good way for troubleshooting is creating a PDF Report. This report will collect a complete ranging profile of an Actor. With the generated PDF it is possible to get a better understanding of the system behaviour.
There are 2 possible Report types:
Position Report: collects positions and analytical data used for calculation
Range Report: collects Anchor-Tracker data, focusing on individually calculated ranges
Note
This feature is only available on MINI and SMART systems. Interpretation of such a report requires a certain level of experience.
Generating a PDF Report
Access the Web Monitor via the IP address of the server in a browser and switch to the Diagnostics tab.
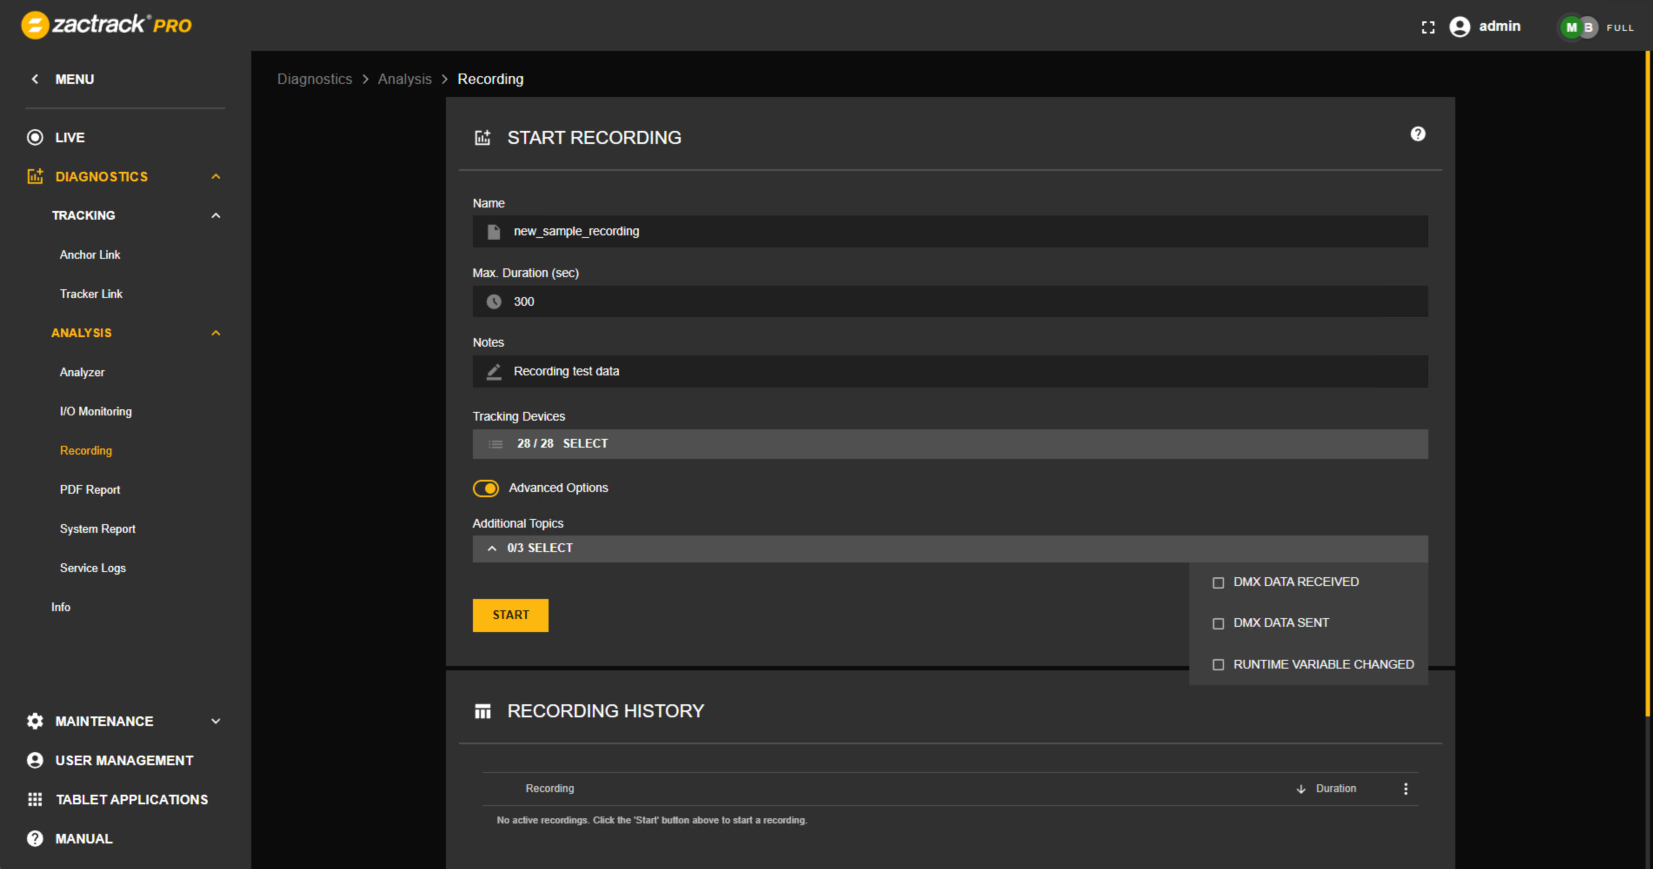
Recording
Basis for a PDF Report is recorded tracking data. Switch to the Recording panel by selecting it from the side panel. Define a name, maximum duration and optionally add some notes. Select the tracking devices and tap the START button to start the recording.
In addition to tracking data, DMX data as well as changes in the runtime variables can be recorded. This can be achieved by enabling the checkbox and selecting the desired options before starting the recording.
The active recording will show up in the table below. Use the Stop button to stop the recording. All previously made recordings can be viewed, downloaded and deleted.
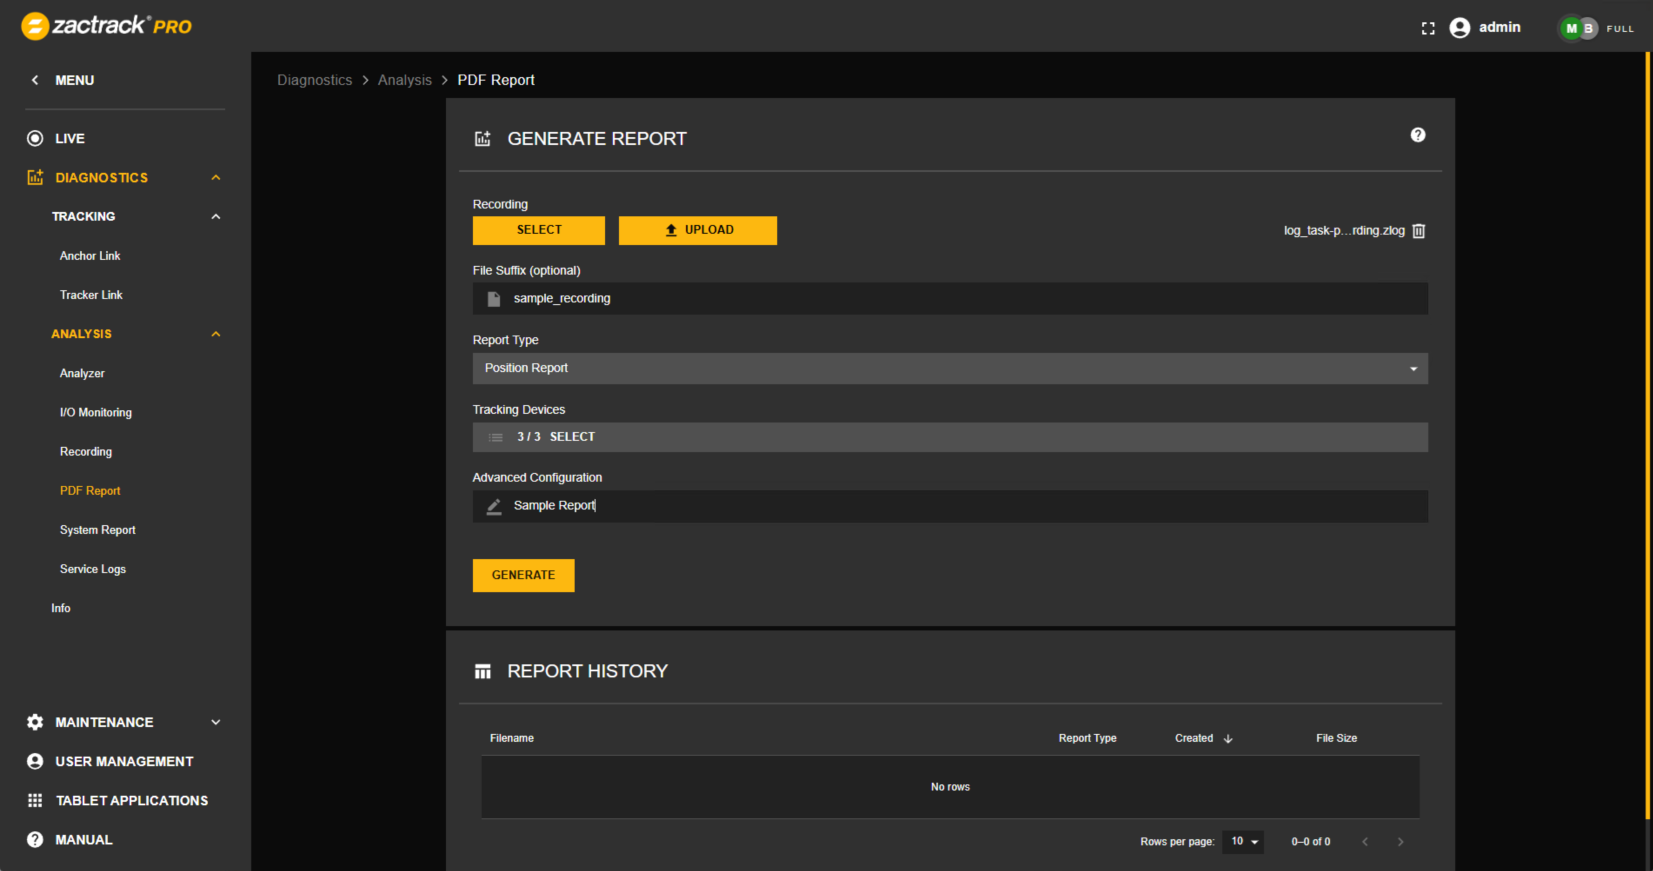
PDF Generator
After creating recorded data, the report can be generated. Switch to the PDF Record panel by selecting it from the side panel. Select a recording from the list or upload a local file. Choose an optional file suffix and select the desired record type (Position or Range). Individual devices can be selected if the recording contains multiple recorded devices. Tap Generate to create the report.
The newly created report as well as previously generated ones can be viewed, downloaded and deleted in the list below.
Each chapter in the Position Report is dedicated to a single tracker. A Position Report can include information for up to five trackers.
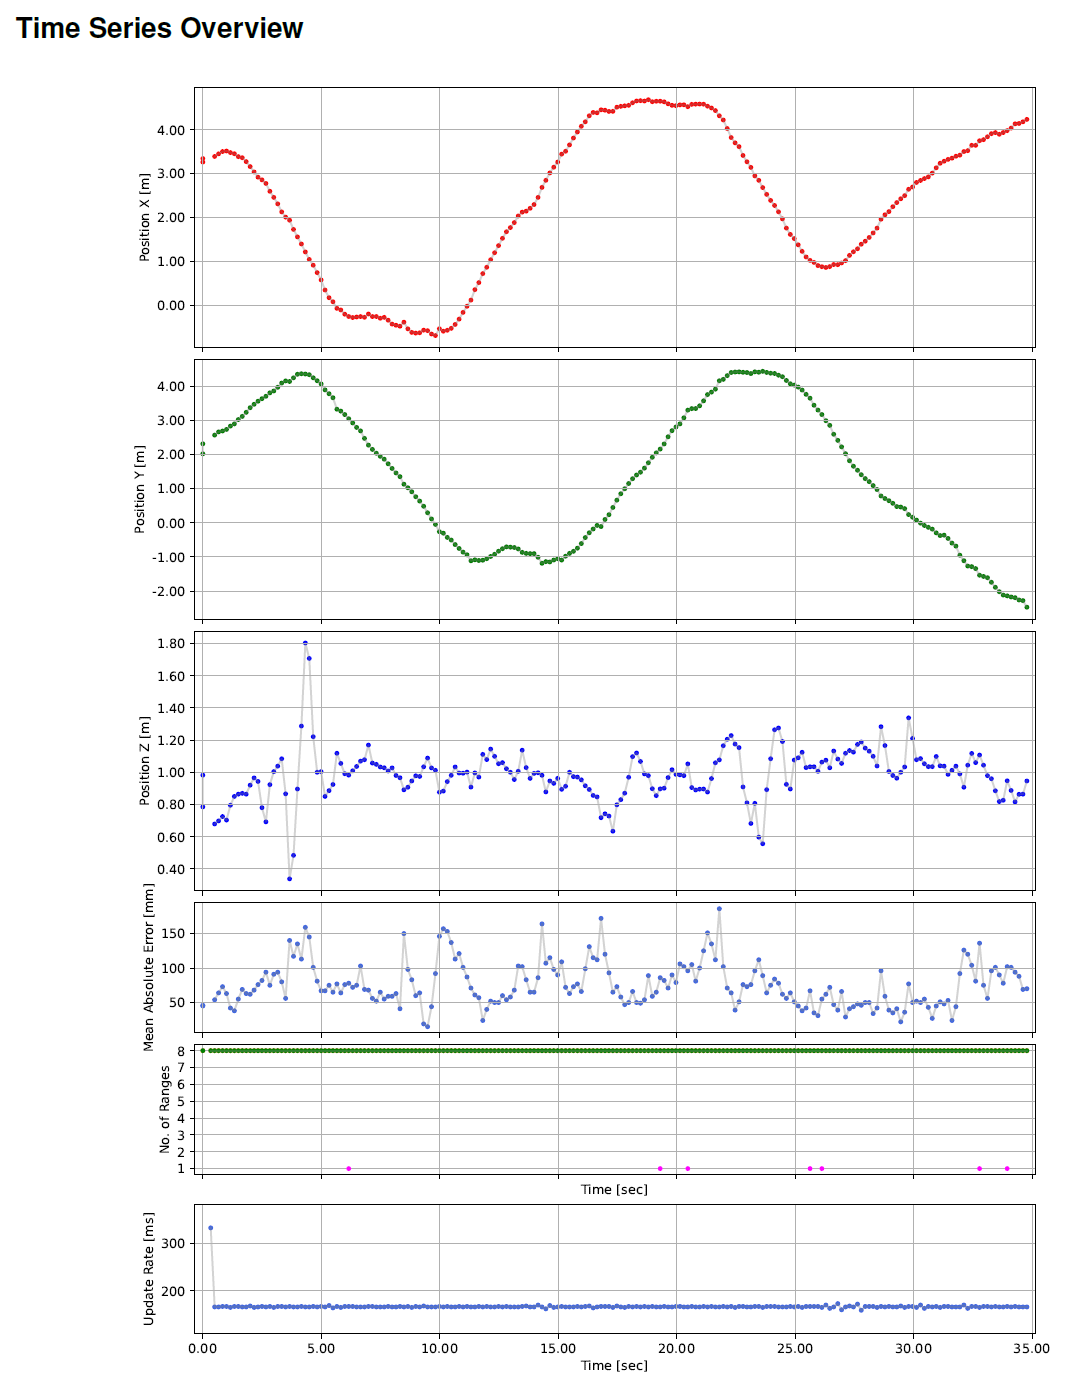
Time Series Overview Time Series Overview has a complete split view of XYZ points. Single points without a course are an indication of bad resolution in an axis.
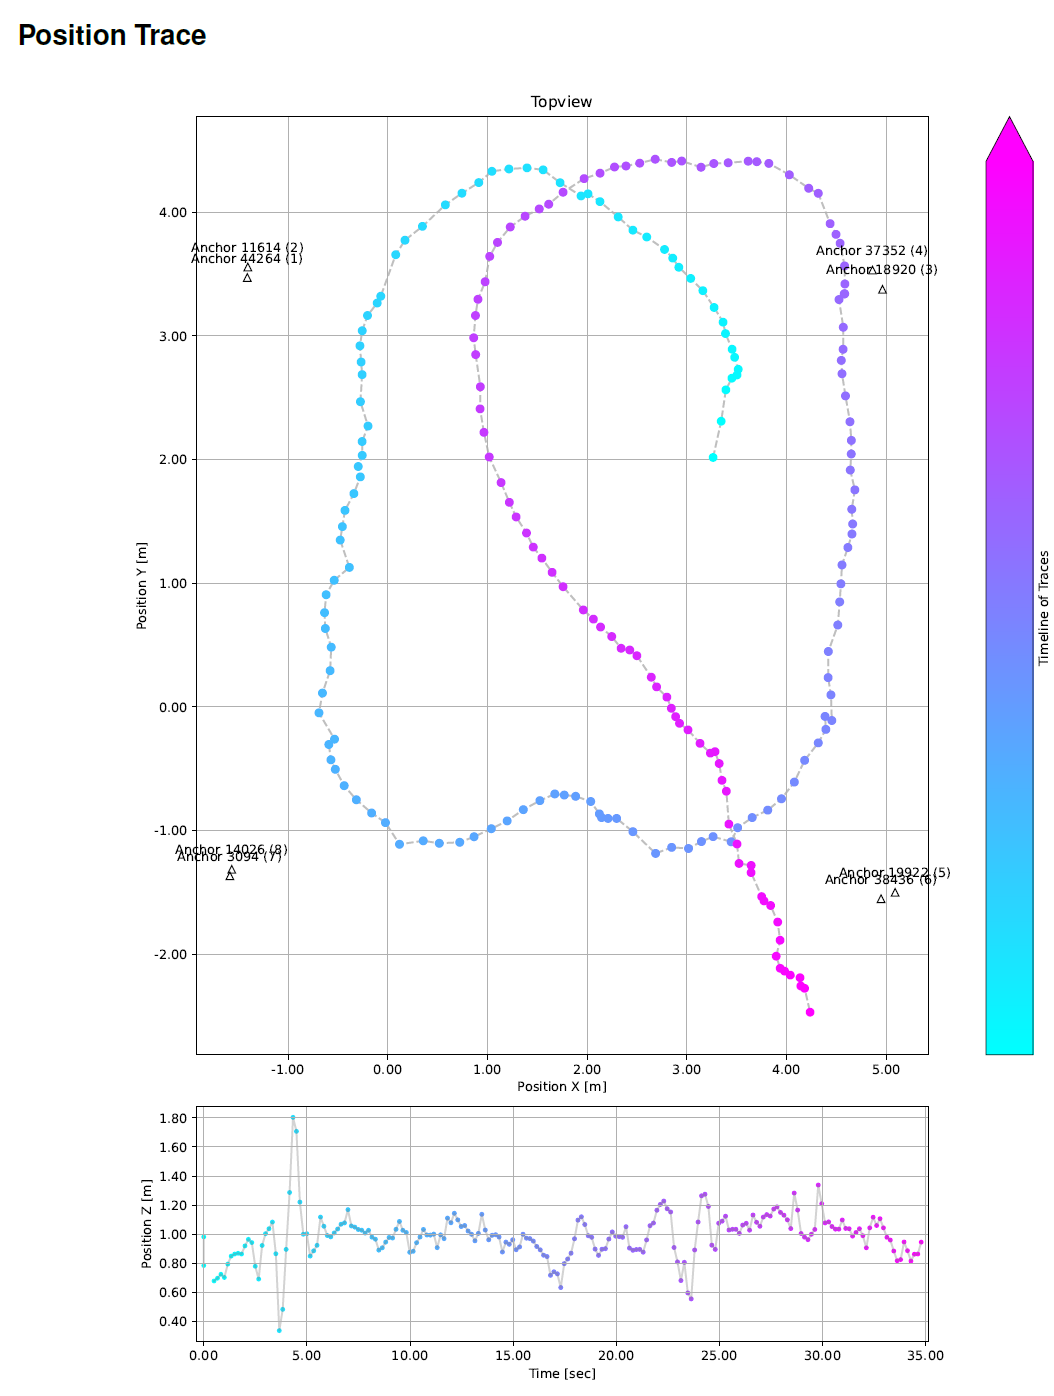
| Position Trace This plot shows the complete path along the XY plane and the Z axis with the color indicating the time.
| ||
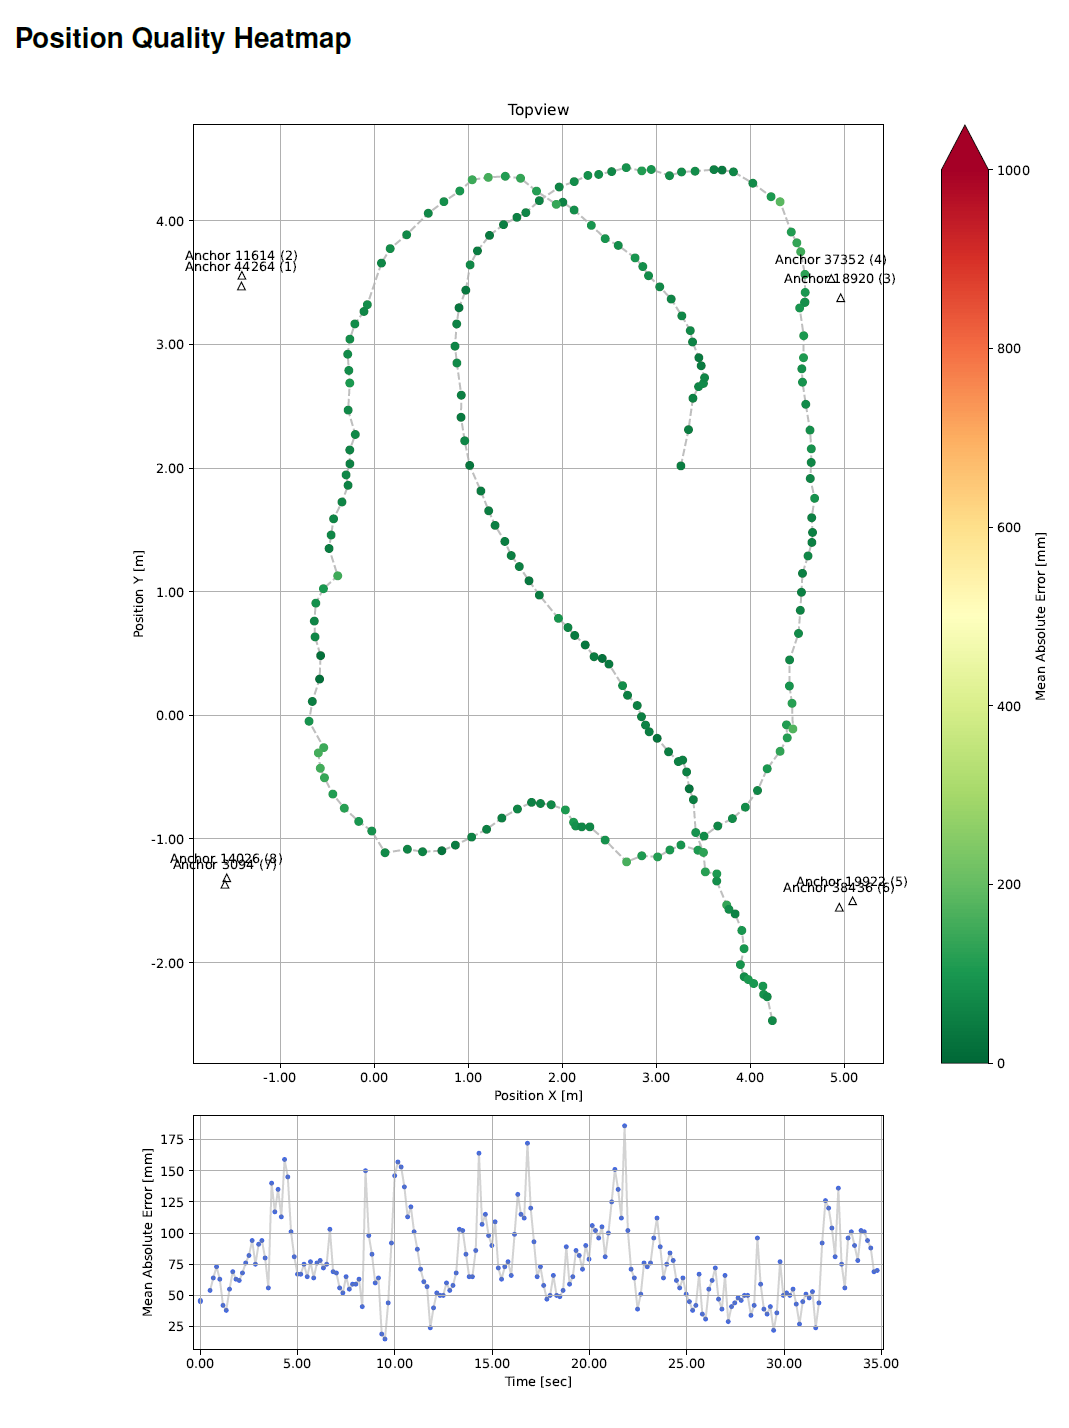
Position Quality Heatmap This plot shows the complete path along the XY plane and the Z axis with the color indicating the mean absolute error.
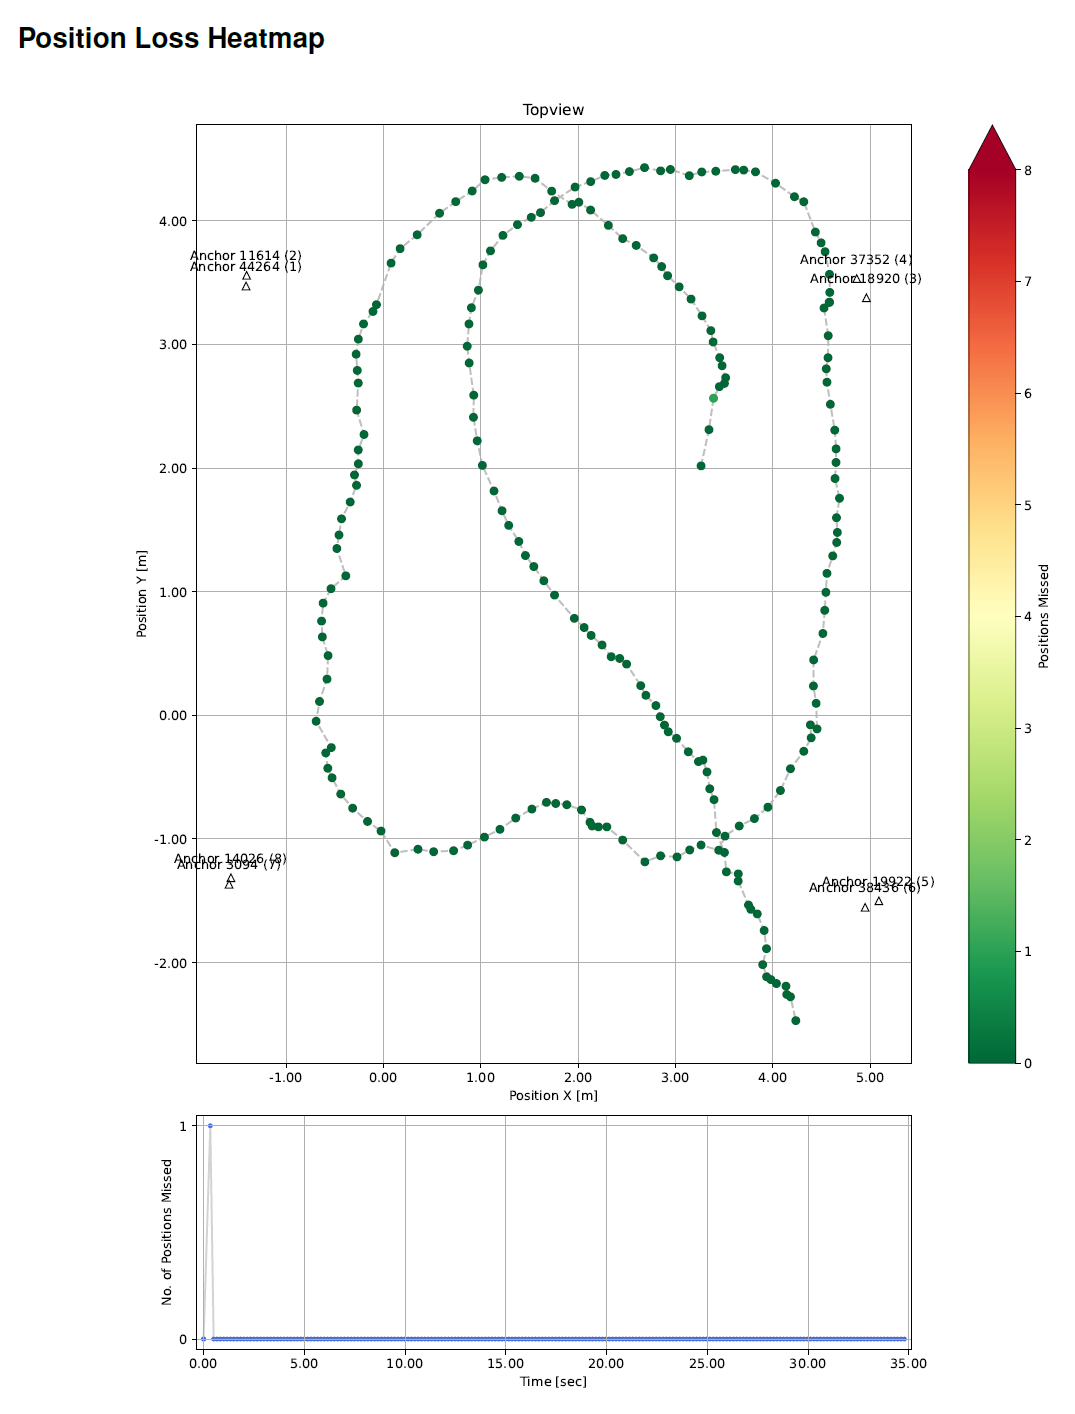
| Position Loss Heatmap This plot displays how many positions have been missed before the current one has been calculated. The more red a position is, the more positions have been missed before it.
| ||
Anchor Usage Heatmap This plot shows the number of anchors used to calculate the position at all points.
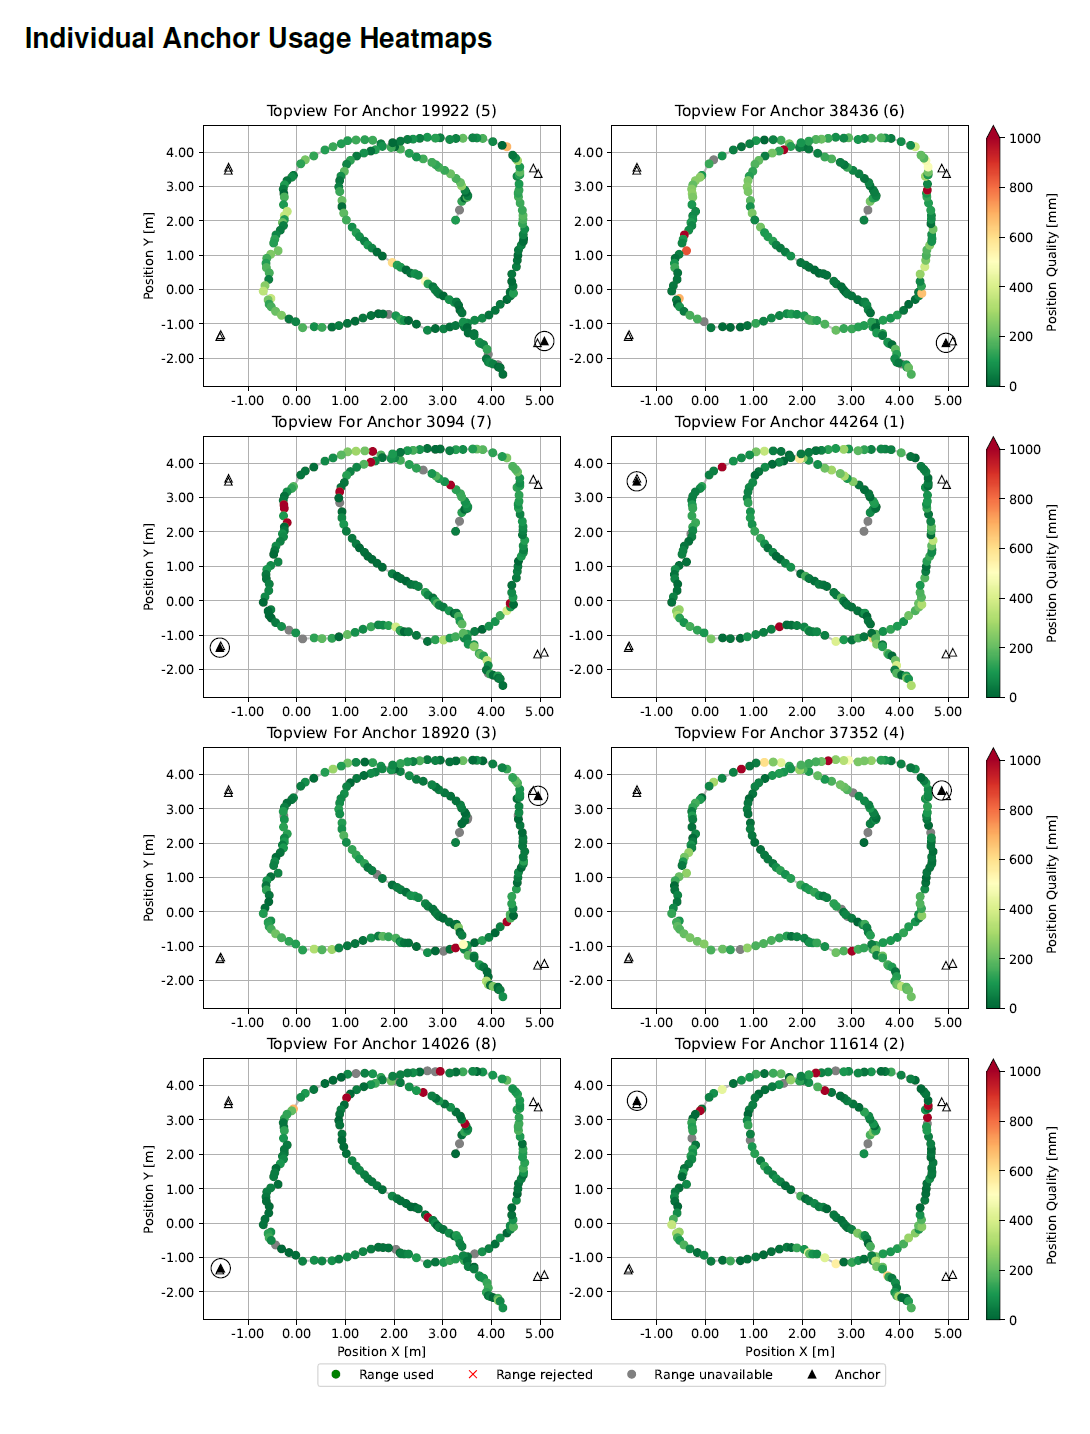
| Individual Anchor Usage Heatmaps This plot shows the contribution of each Anchor to all positions with the color indicating the quality of the data.
| ||
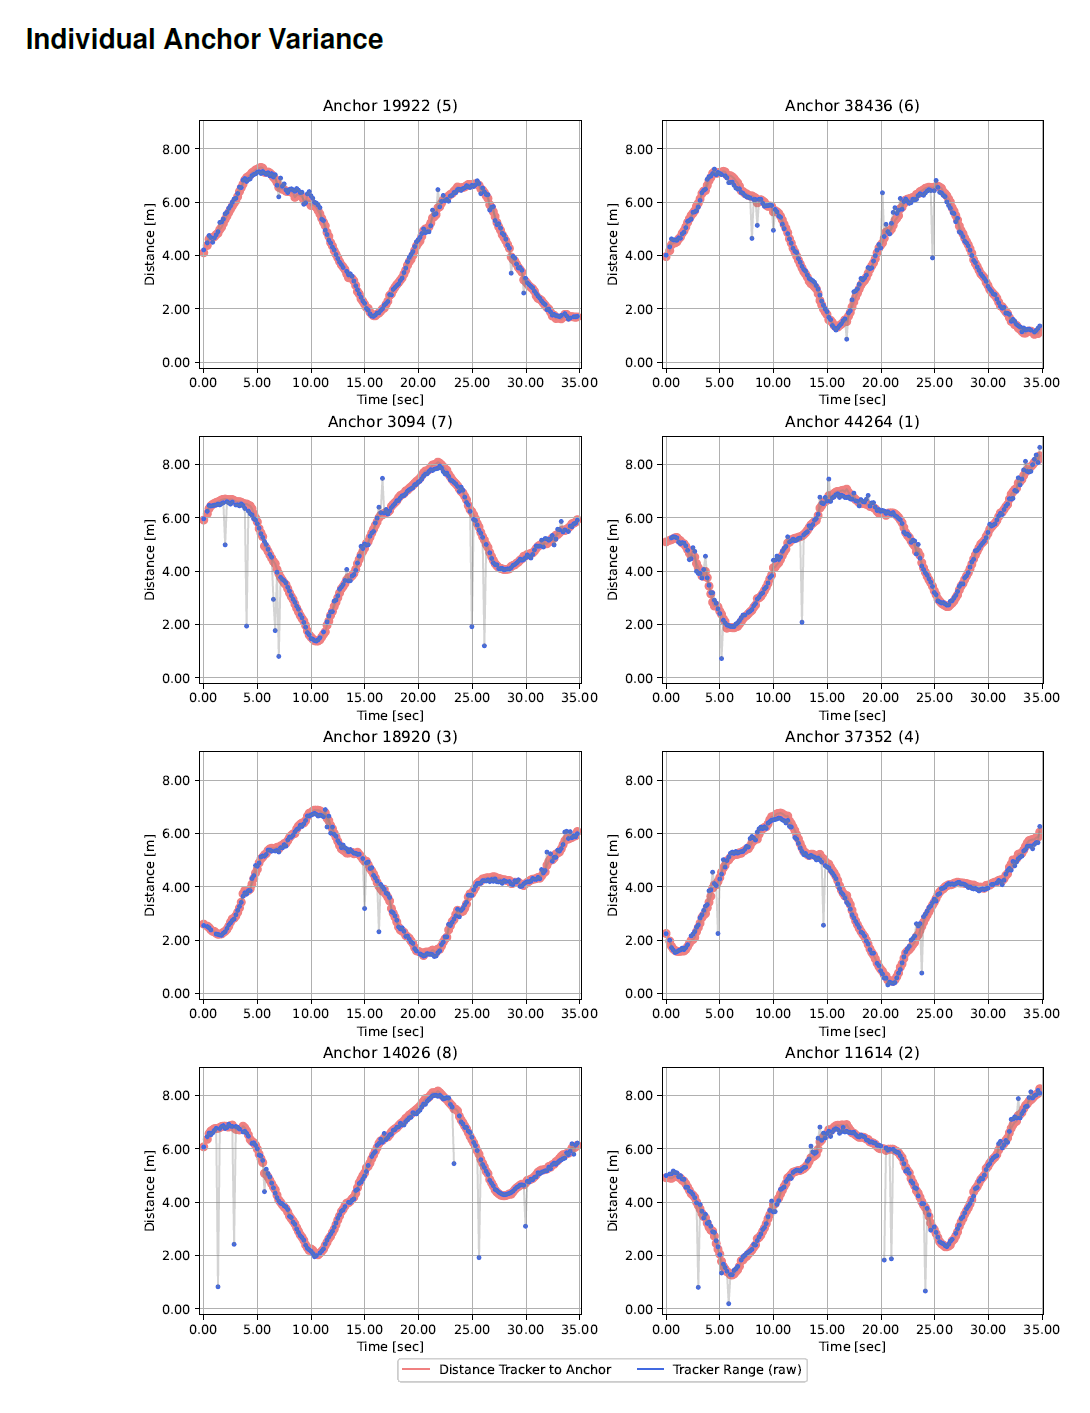
Individual Anchor Variance This plot shows the calculated, raw range in red for every Anchor. The blue data is the filtered range.
|

Note
Reports generated on MINI systems only contain 2D data.
Examples for issues displayed in the Position Report
Here are some examples for obvious issues.
Individual Anchor Variance
Here is an example of a wrongly measured Anchor. In the top right corner a picture of a shifted blue line is seen. The Anchor collects correct ranges but its own position is wrong. The spikes are reflections.
Individal Anchor Usage Heatmap
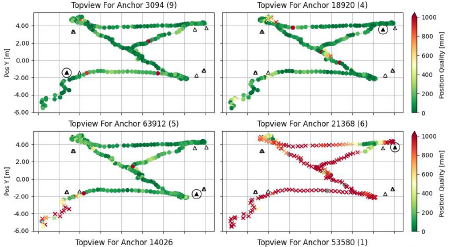
There is a problem with the Anchor in the bottom row at the right side. The position quality is noticeably bad. This can be a wrongly measured Anchor or a permanent reflection.
Time Series Overview
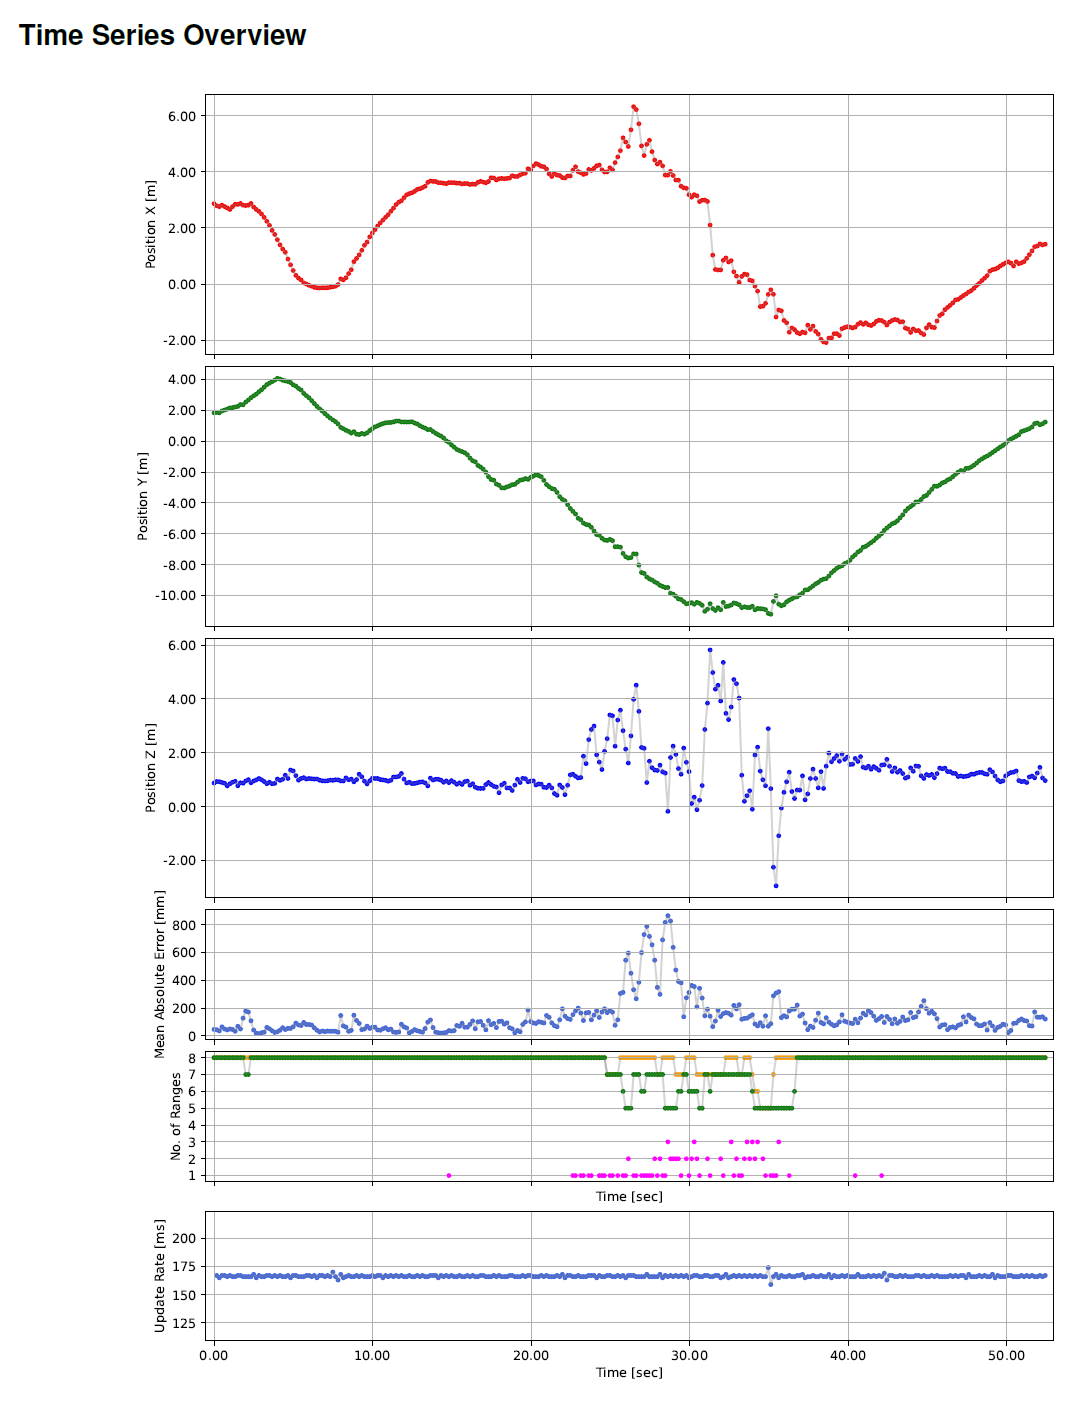
The area where no positions for X, Y, and Z have been calculated indicates that the tracker's position was completely lost during this time period. The spike in the "Mean Absolute Error" chart further supports this.
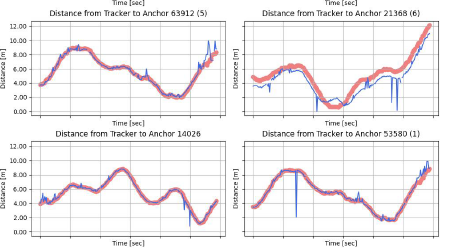
The Range Report collects every single range from Anchor to Tracker.
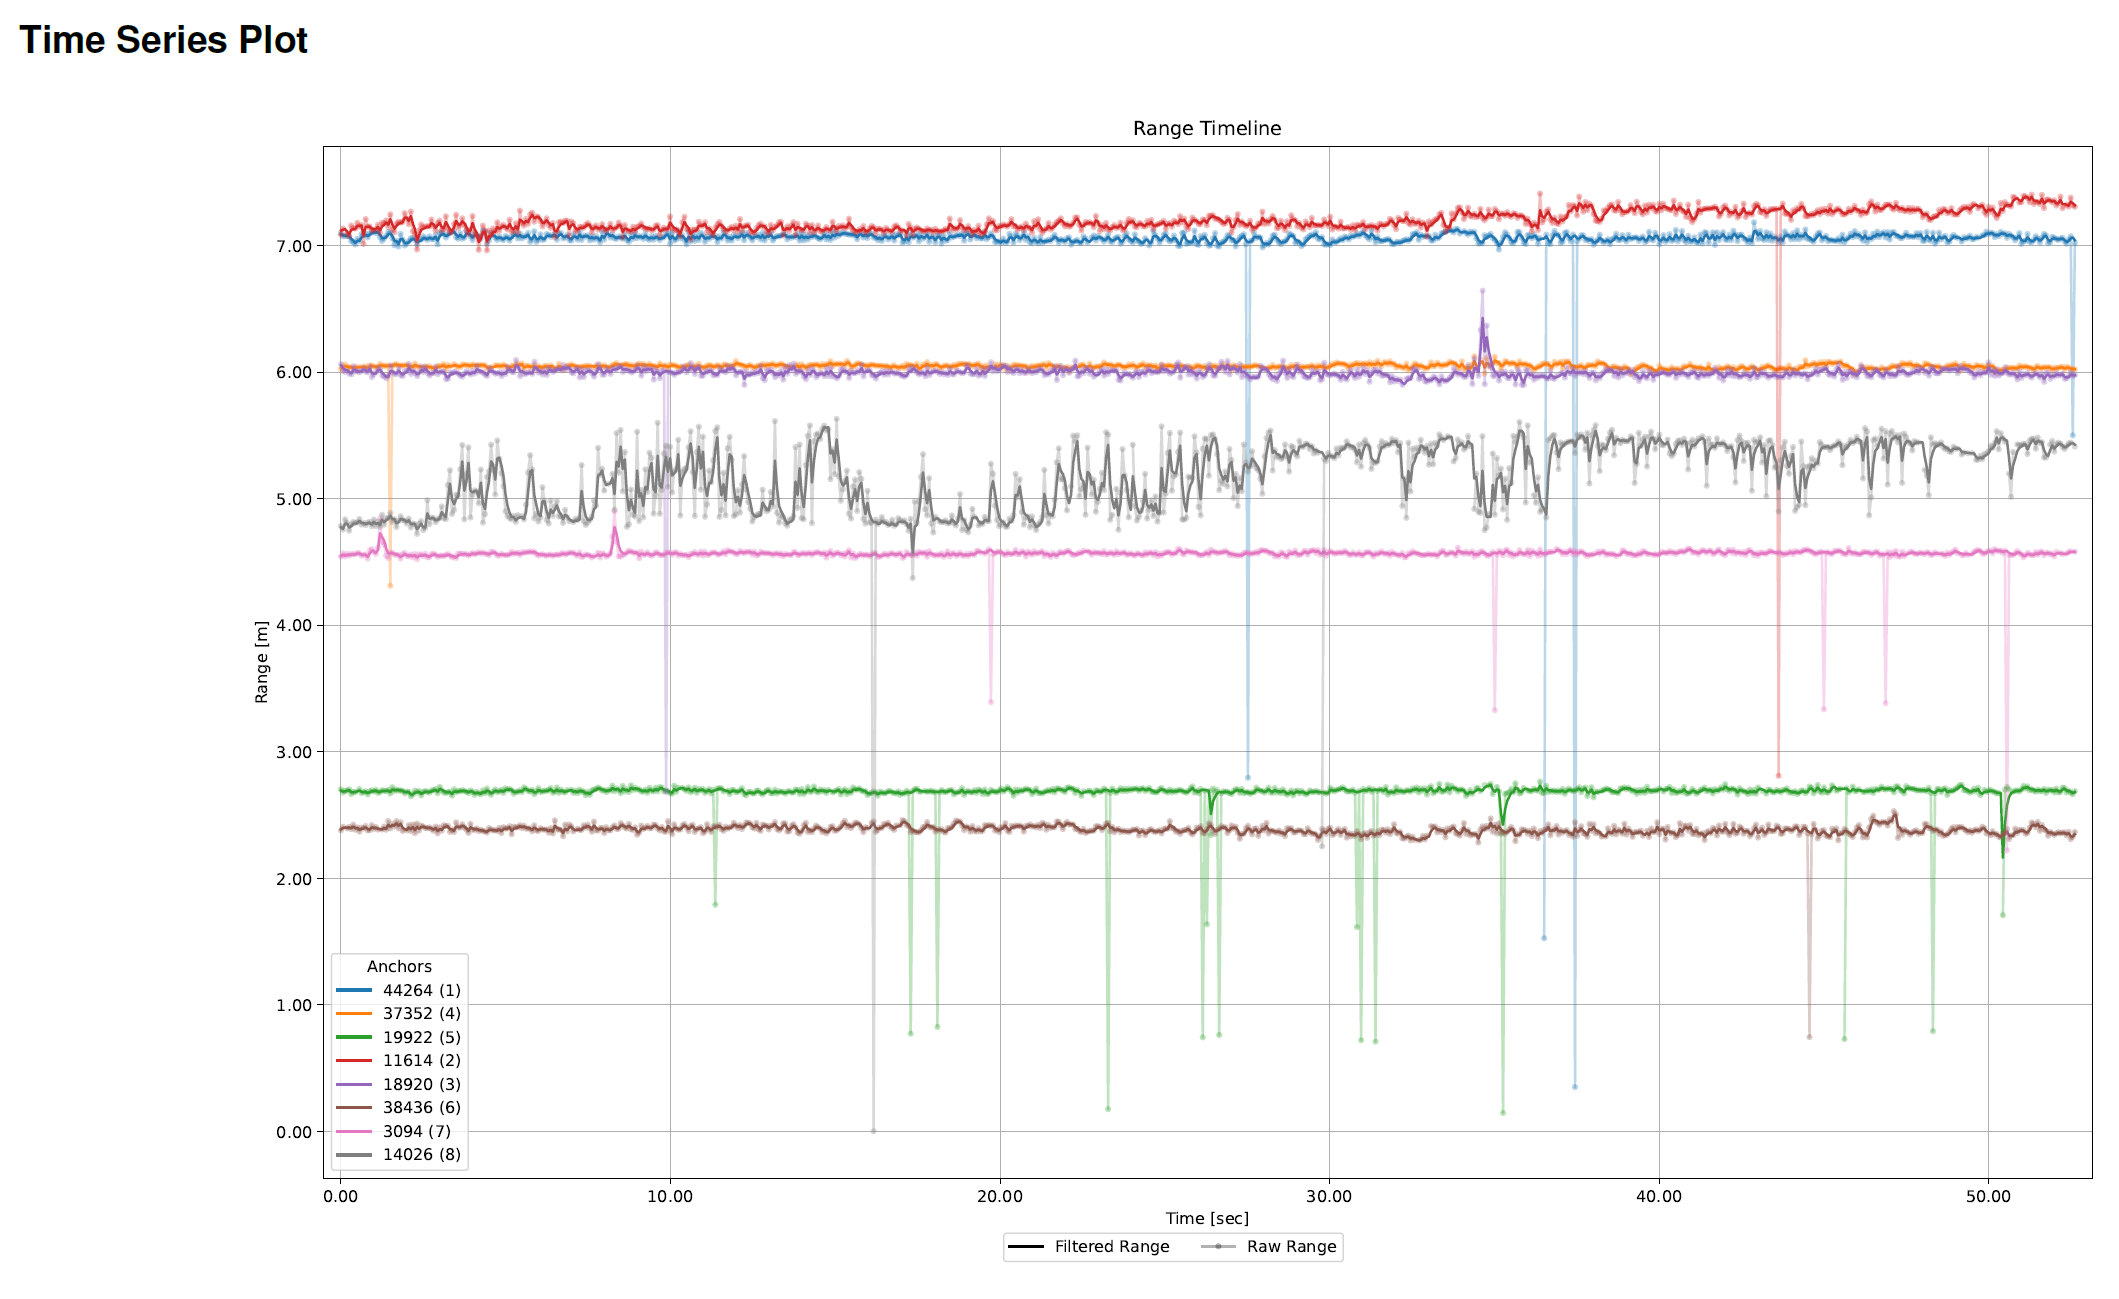
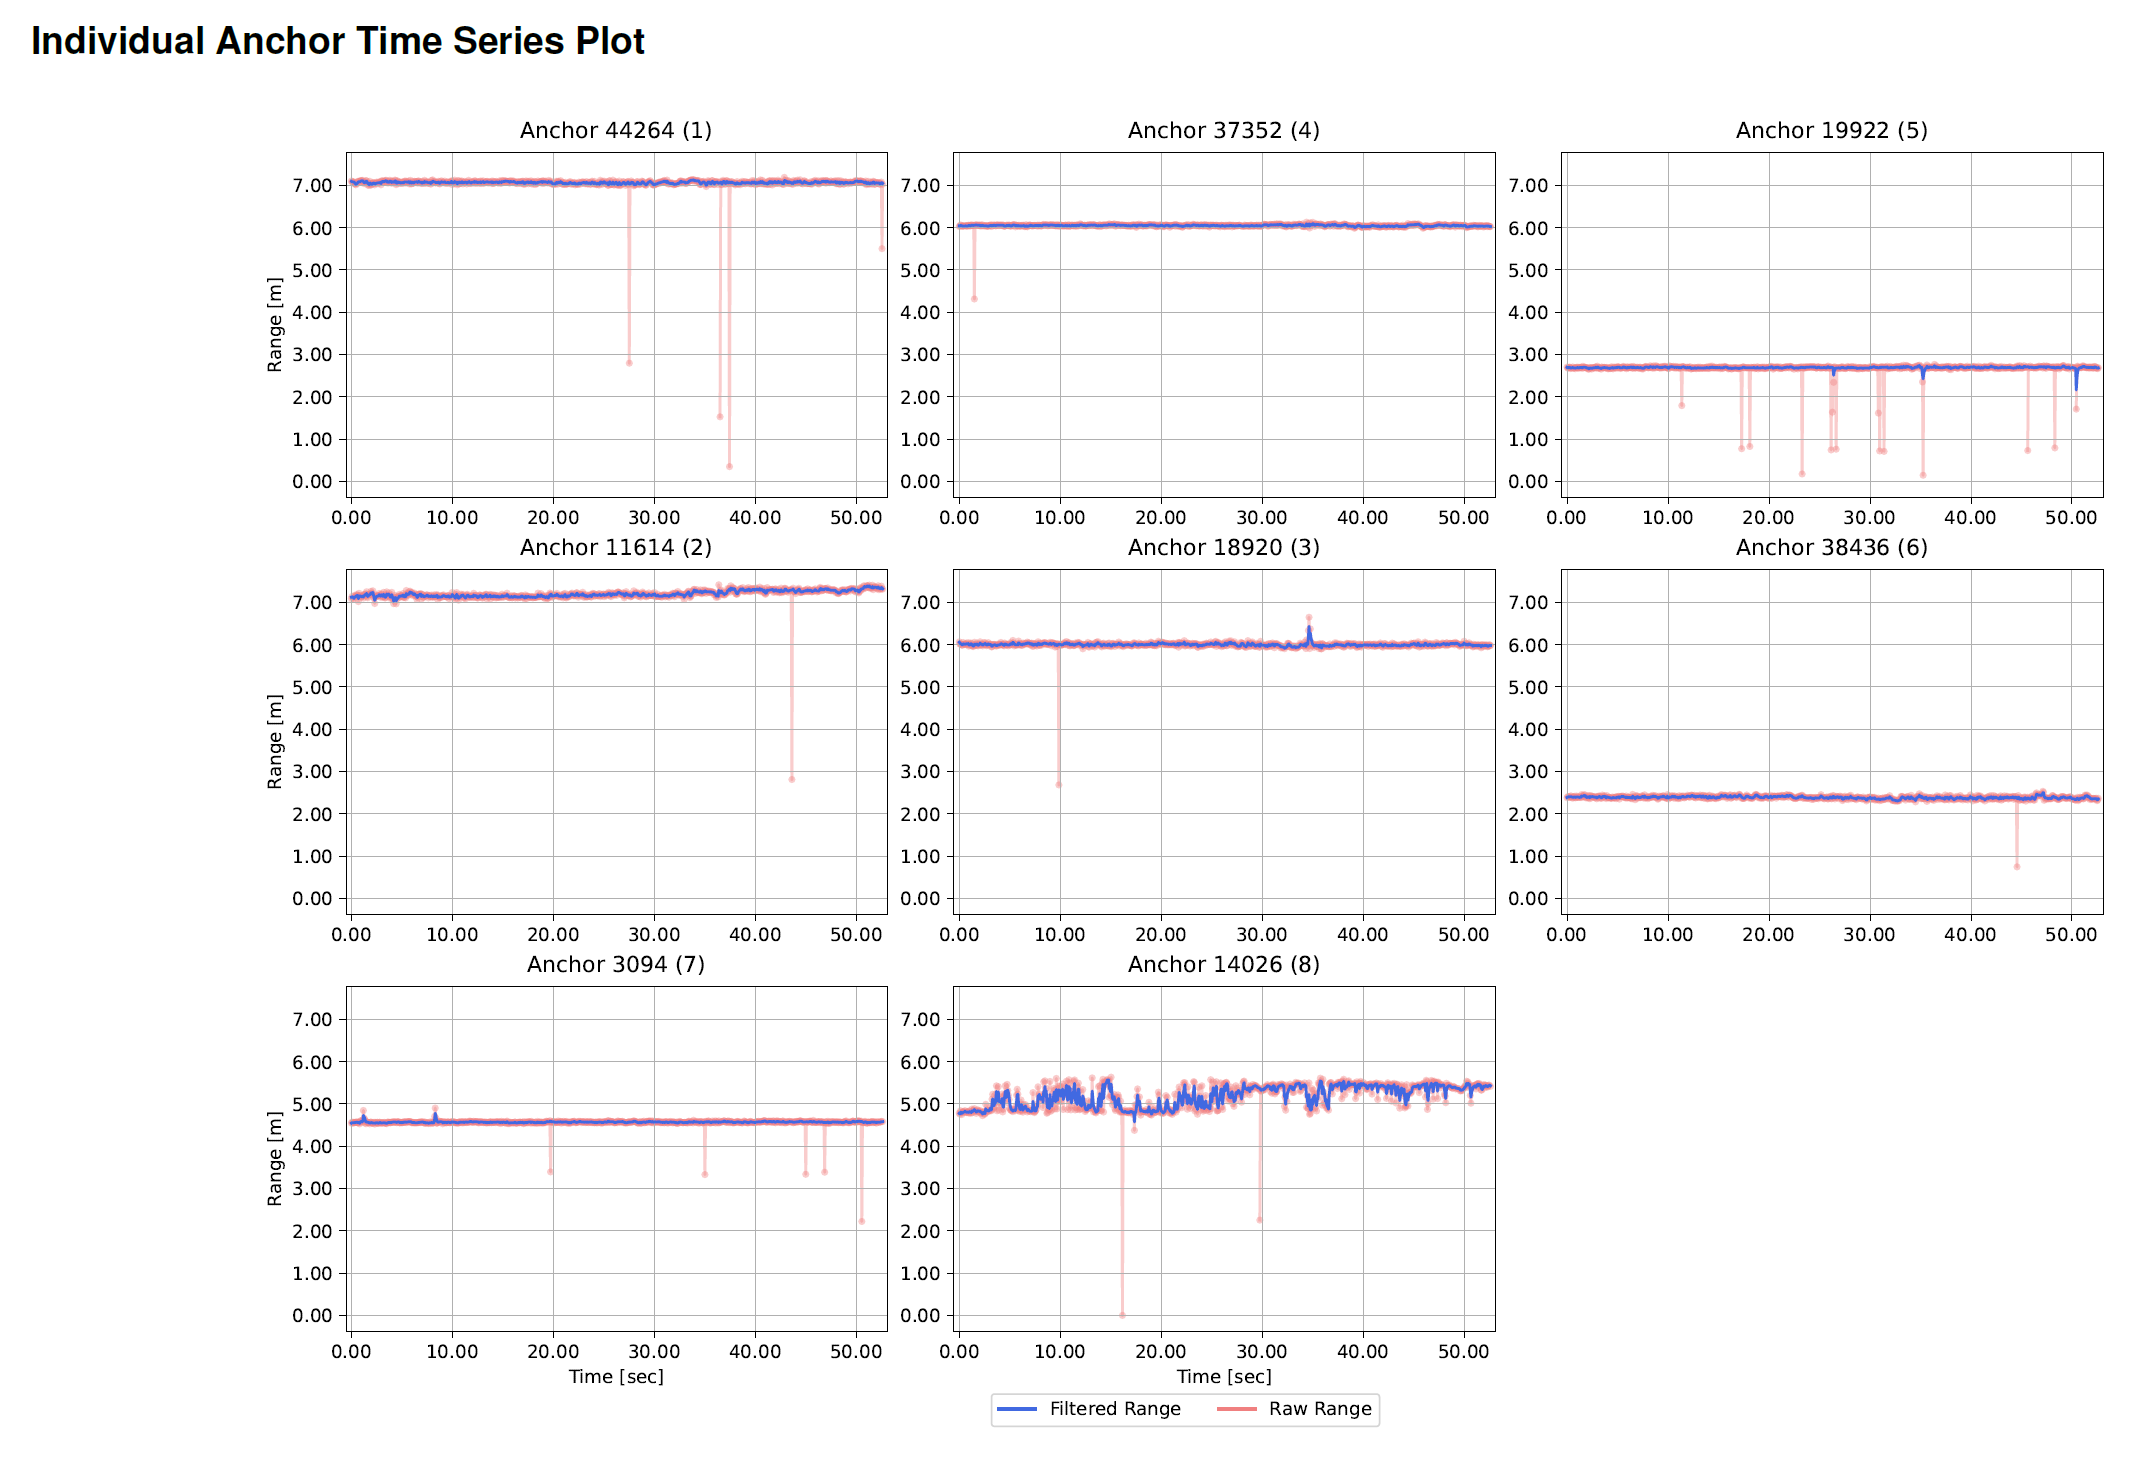
Anchor Time Series Plot
This plot shows the range of a Tracker to all individual Anchors over time. Each plot contains both the raw and the filtered range values.
Time Series Plot
This plot shows the range of a Tracker to all individual Anchors in one combined plot. Again, both the raw and the filtered range values are displayed.