I/O Monitoring
The I/O monitor provides an overview of all control signals being received and sent by the zactrack server. It is a useful tool to check network connections during the setup process as well as monitoring the dataflow during a performance. This feature is available in the Web Monitor as well as the App, see I/O Monitoring.
 |
The I/O monitor supports the following protocols:
Streaming ACN (sACN)
Displaying statistics for incoming and outgoing sACN DMX packets.
PosiStageNet (PSN)
Displaying statistics for incoming and outgoing PSN packets.
Open Sound Control (OSC)
Displaying statistics for incoming and outgoing OSC packets.
Tracking
Displaying statistics for incoming tracking data, such as trackers from the system's own RTLS or a Proxy.
Art-Net
Displaying statistics for incoming and outgoing Art-Net DMX packets.
Note
The respective protocol input/output has to be activated and configured in the System Settings in order to be received/sent.
Navigation
The I/O Monitor is organized in 3 parts:
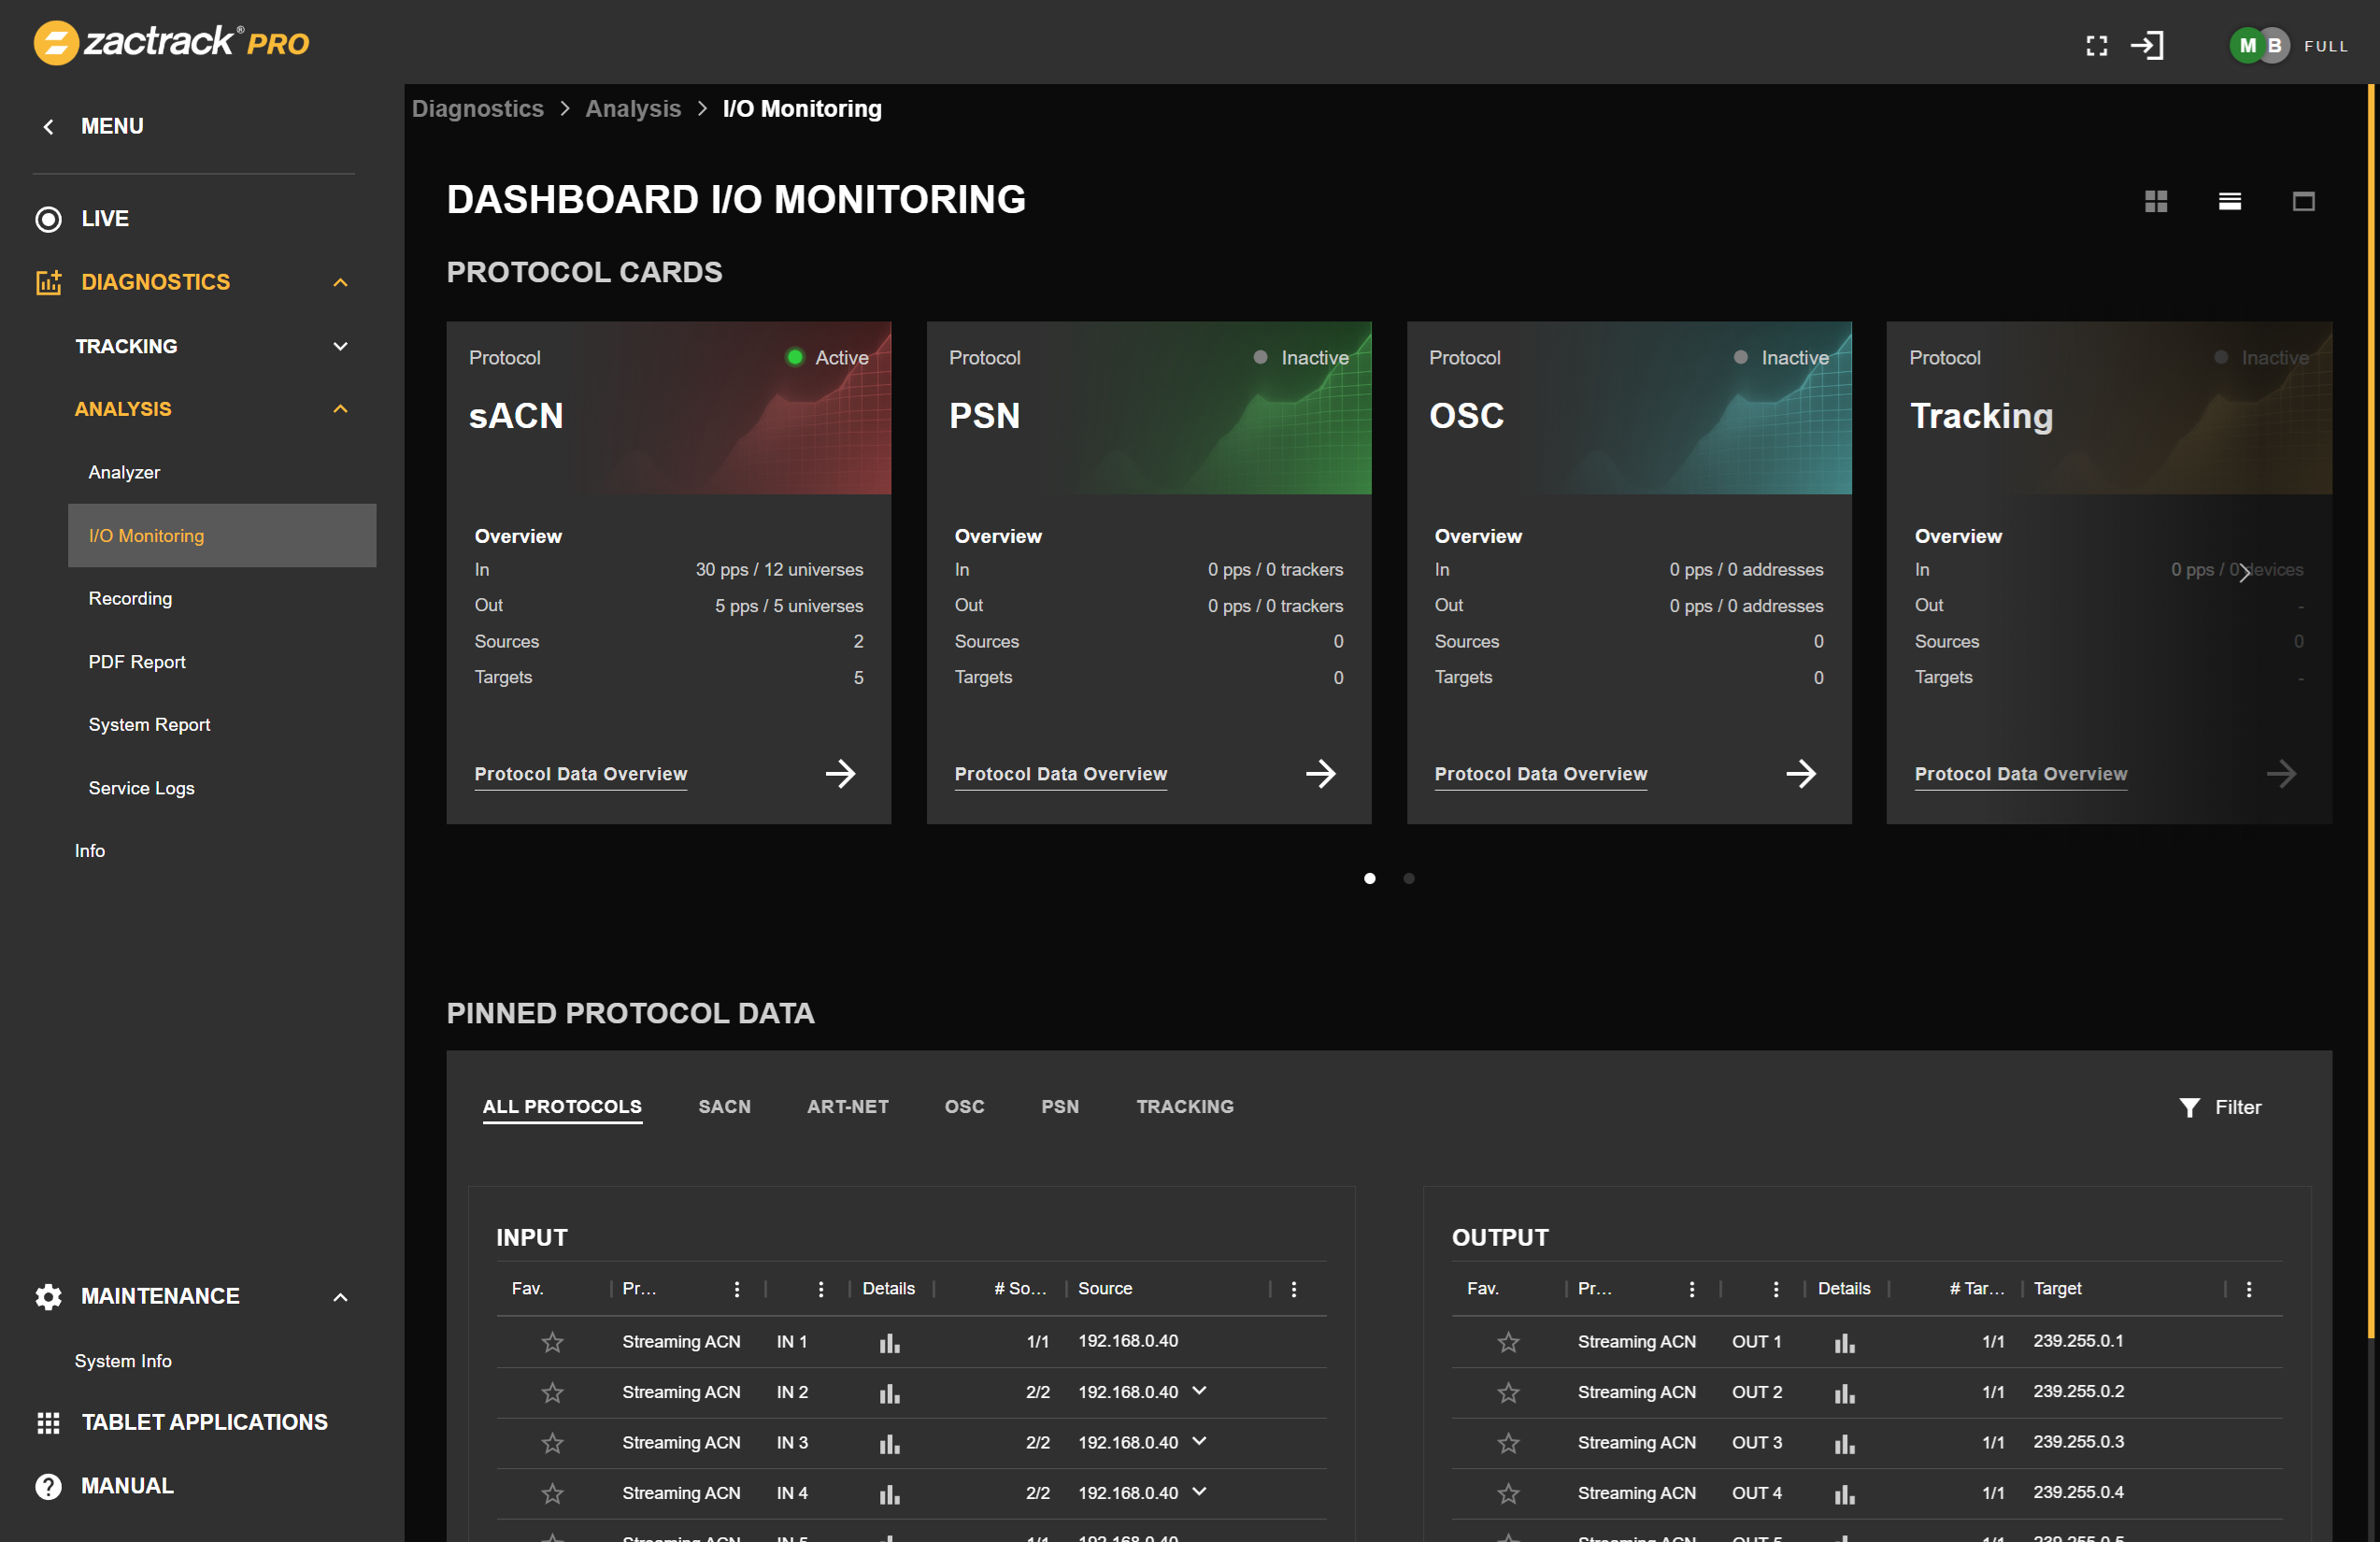
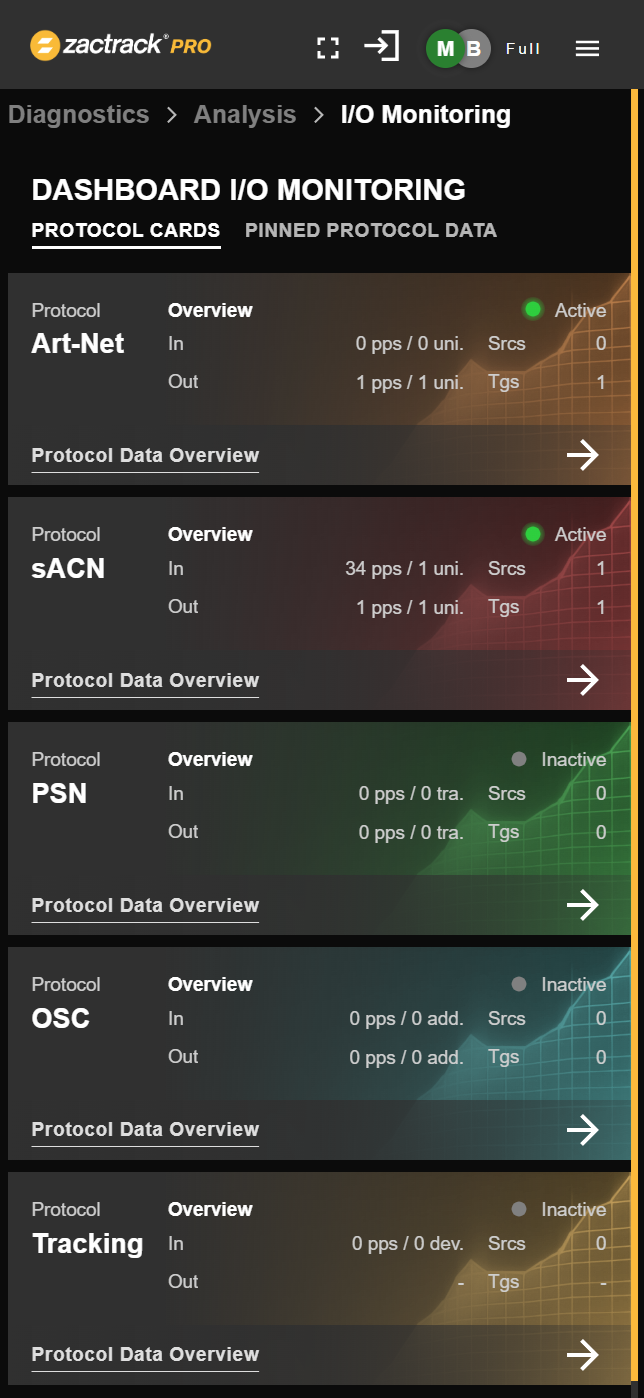
Dashboard
Provides an overview of the statistics for a specific protocol. The indicator in the top right corner indicates active input. Underneath the protocol cards, protocol data is displayed in list views.
Protocol View
Provides a tabbed list view on incoming and outgoing data for all protocols acting as a customizable quick-view with user-defined filters.
Detail View
Provides a detailed view for a specific datastream.
When opening the I/O Monitor, the dashboard is presented. The view can be adapted by using the 3 buttons on the top right.
 shows the protocol cards.
 shows both protocol cards and pinned protocol data underneath.
 maximizes the pinned protocol data
Clicking a protocol card will open a maximized protocol view for the respective data type. The search field on the top right of the view can be used to filter for specific packets. By clicking the title, the view can be switched to show a different protocol.
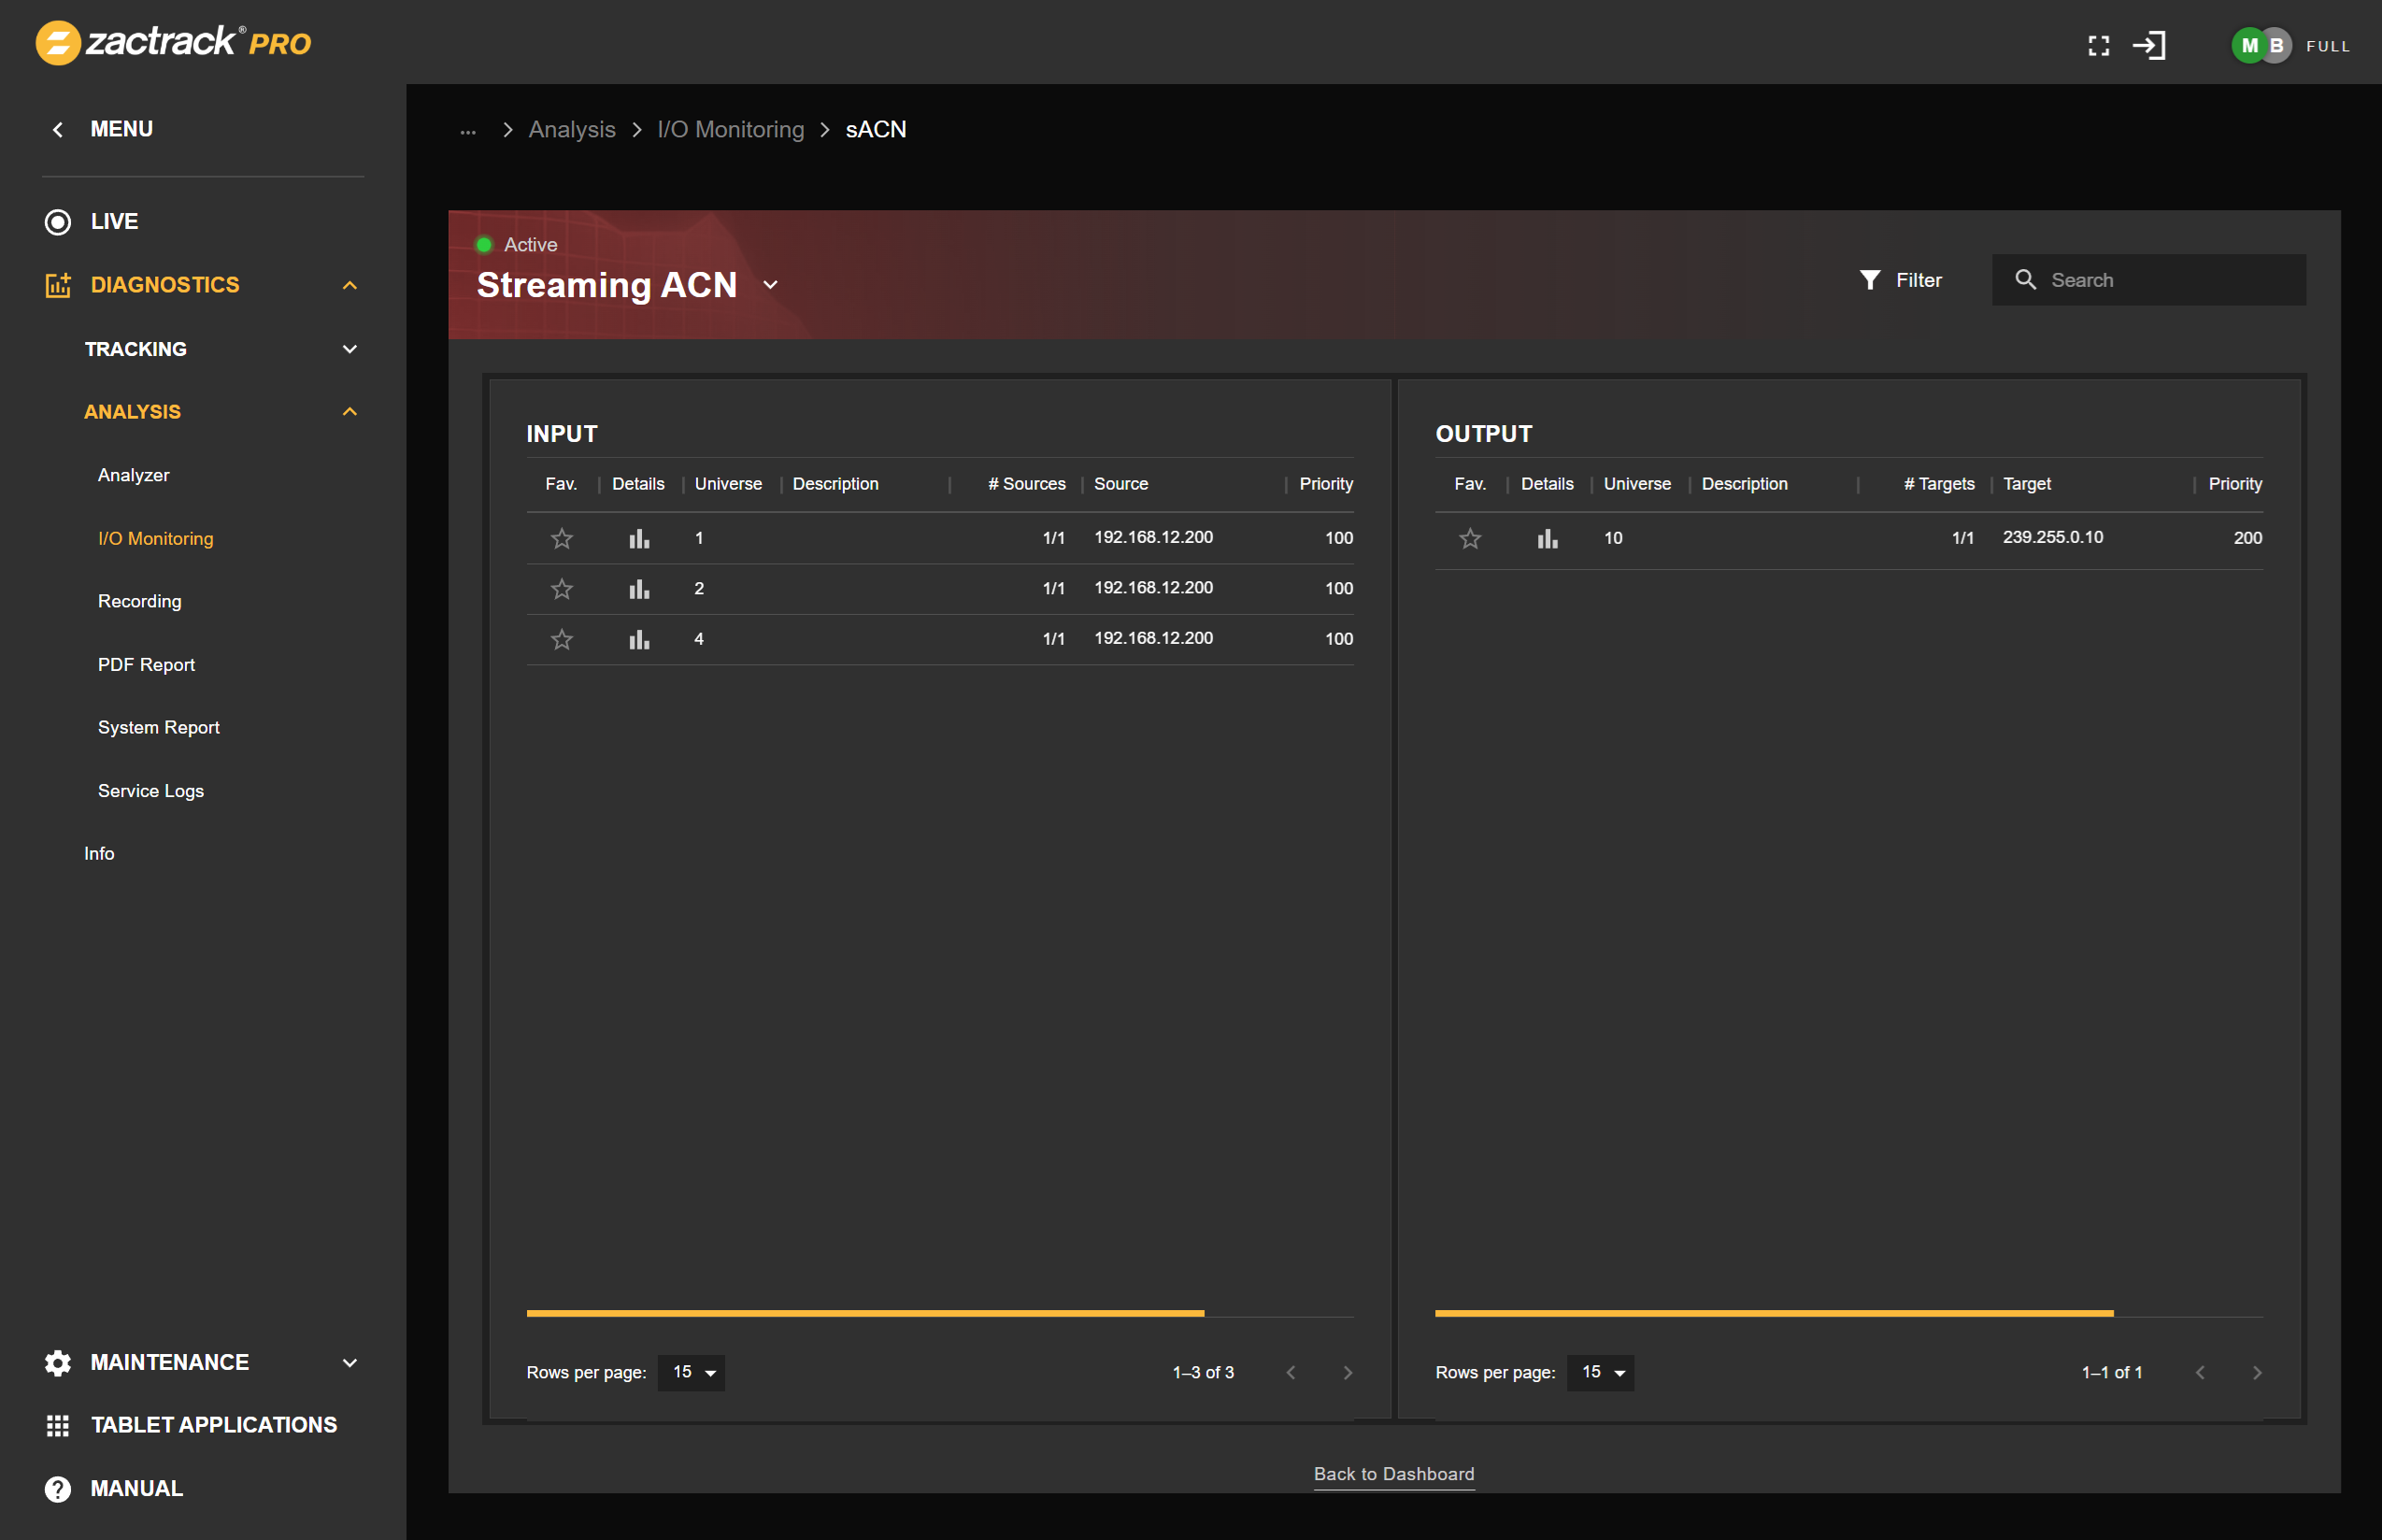 |
The dashboard can be accessed by clicking on the bottom center of the list view, by using the breadcrumb line above the view title or via the menu in the left sidebar.
Clicking on a list entry will open the detail view for the specific datastream. If the same data is received by multiple sources or sent to multiple targets, information about a specific source/target can be selected from the upper list.
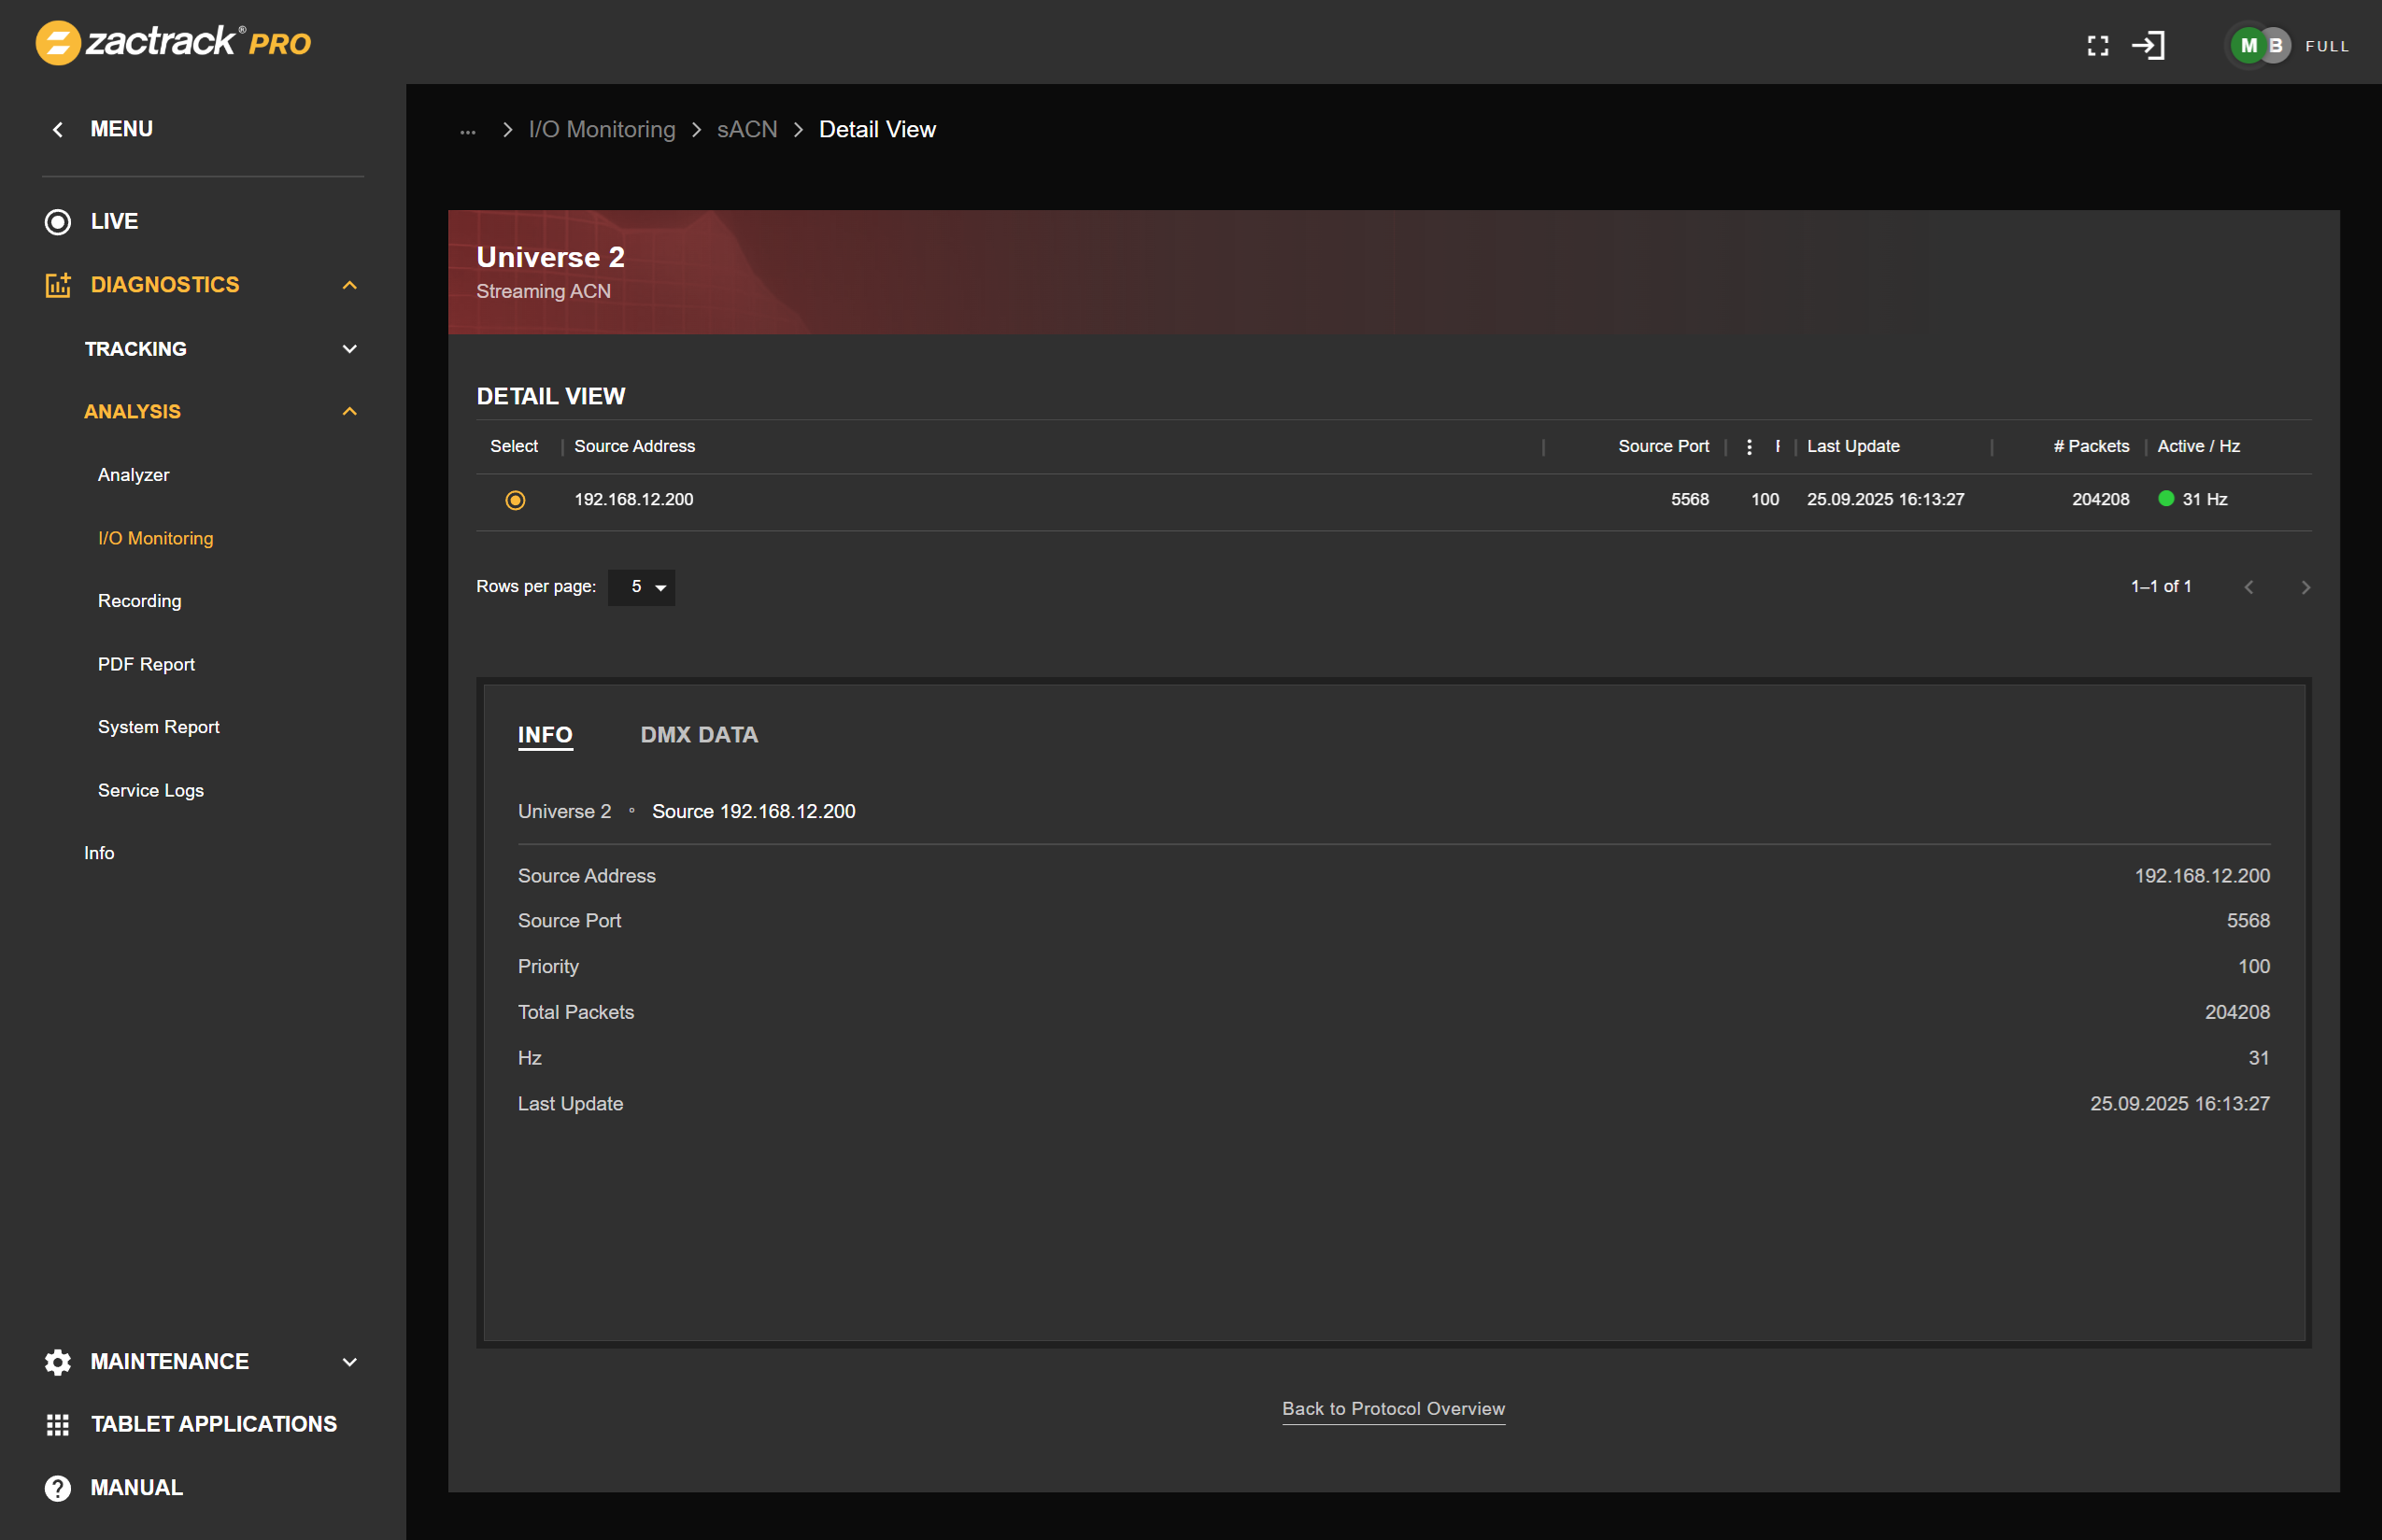 |
Detailed datastream information such as data for individual DMX channels can be viewed by switching to the respective tab.
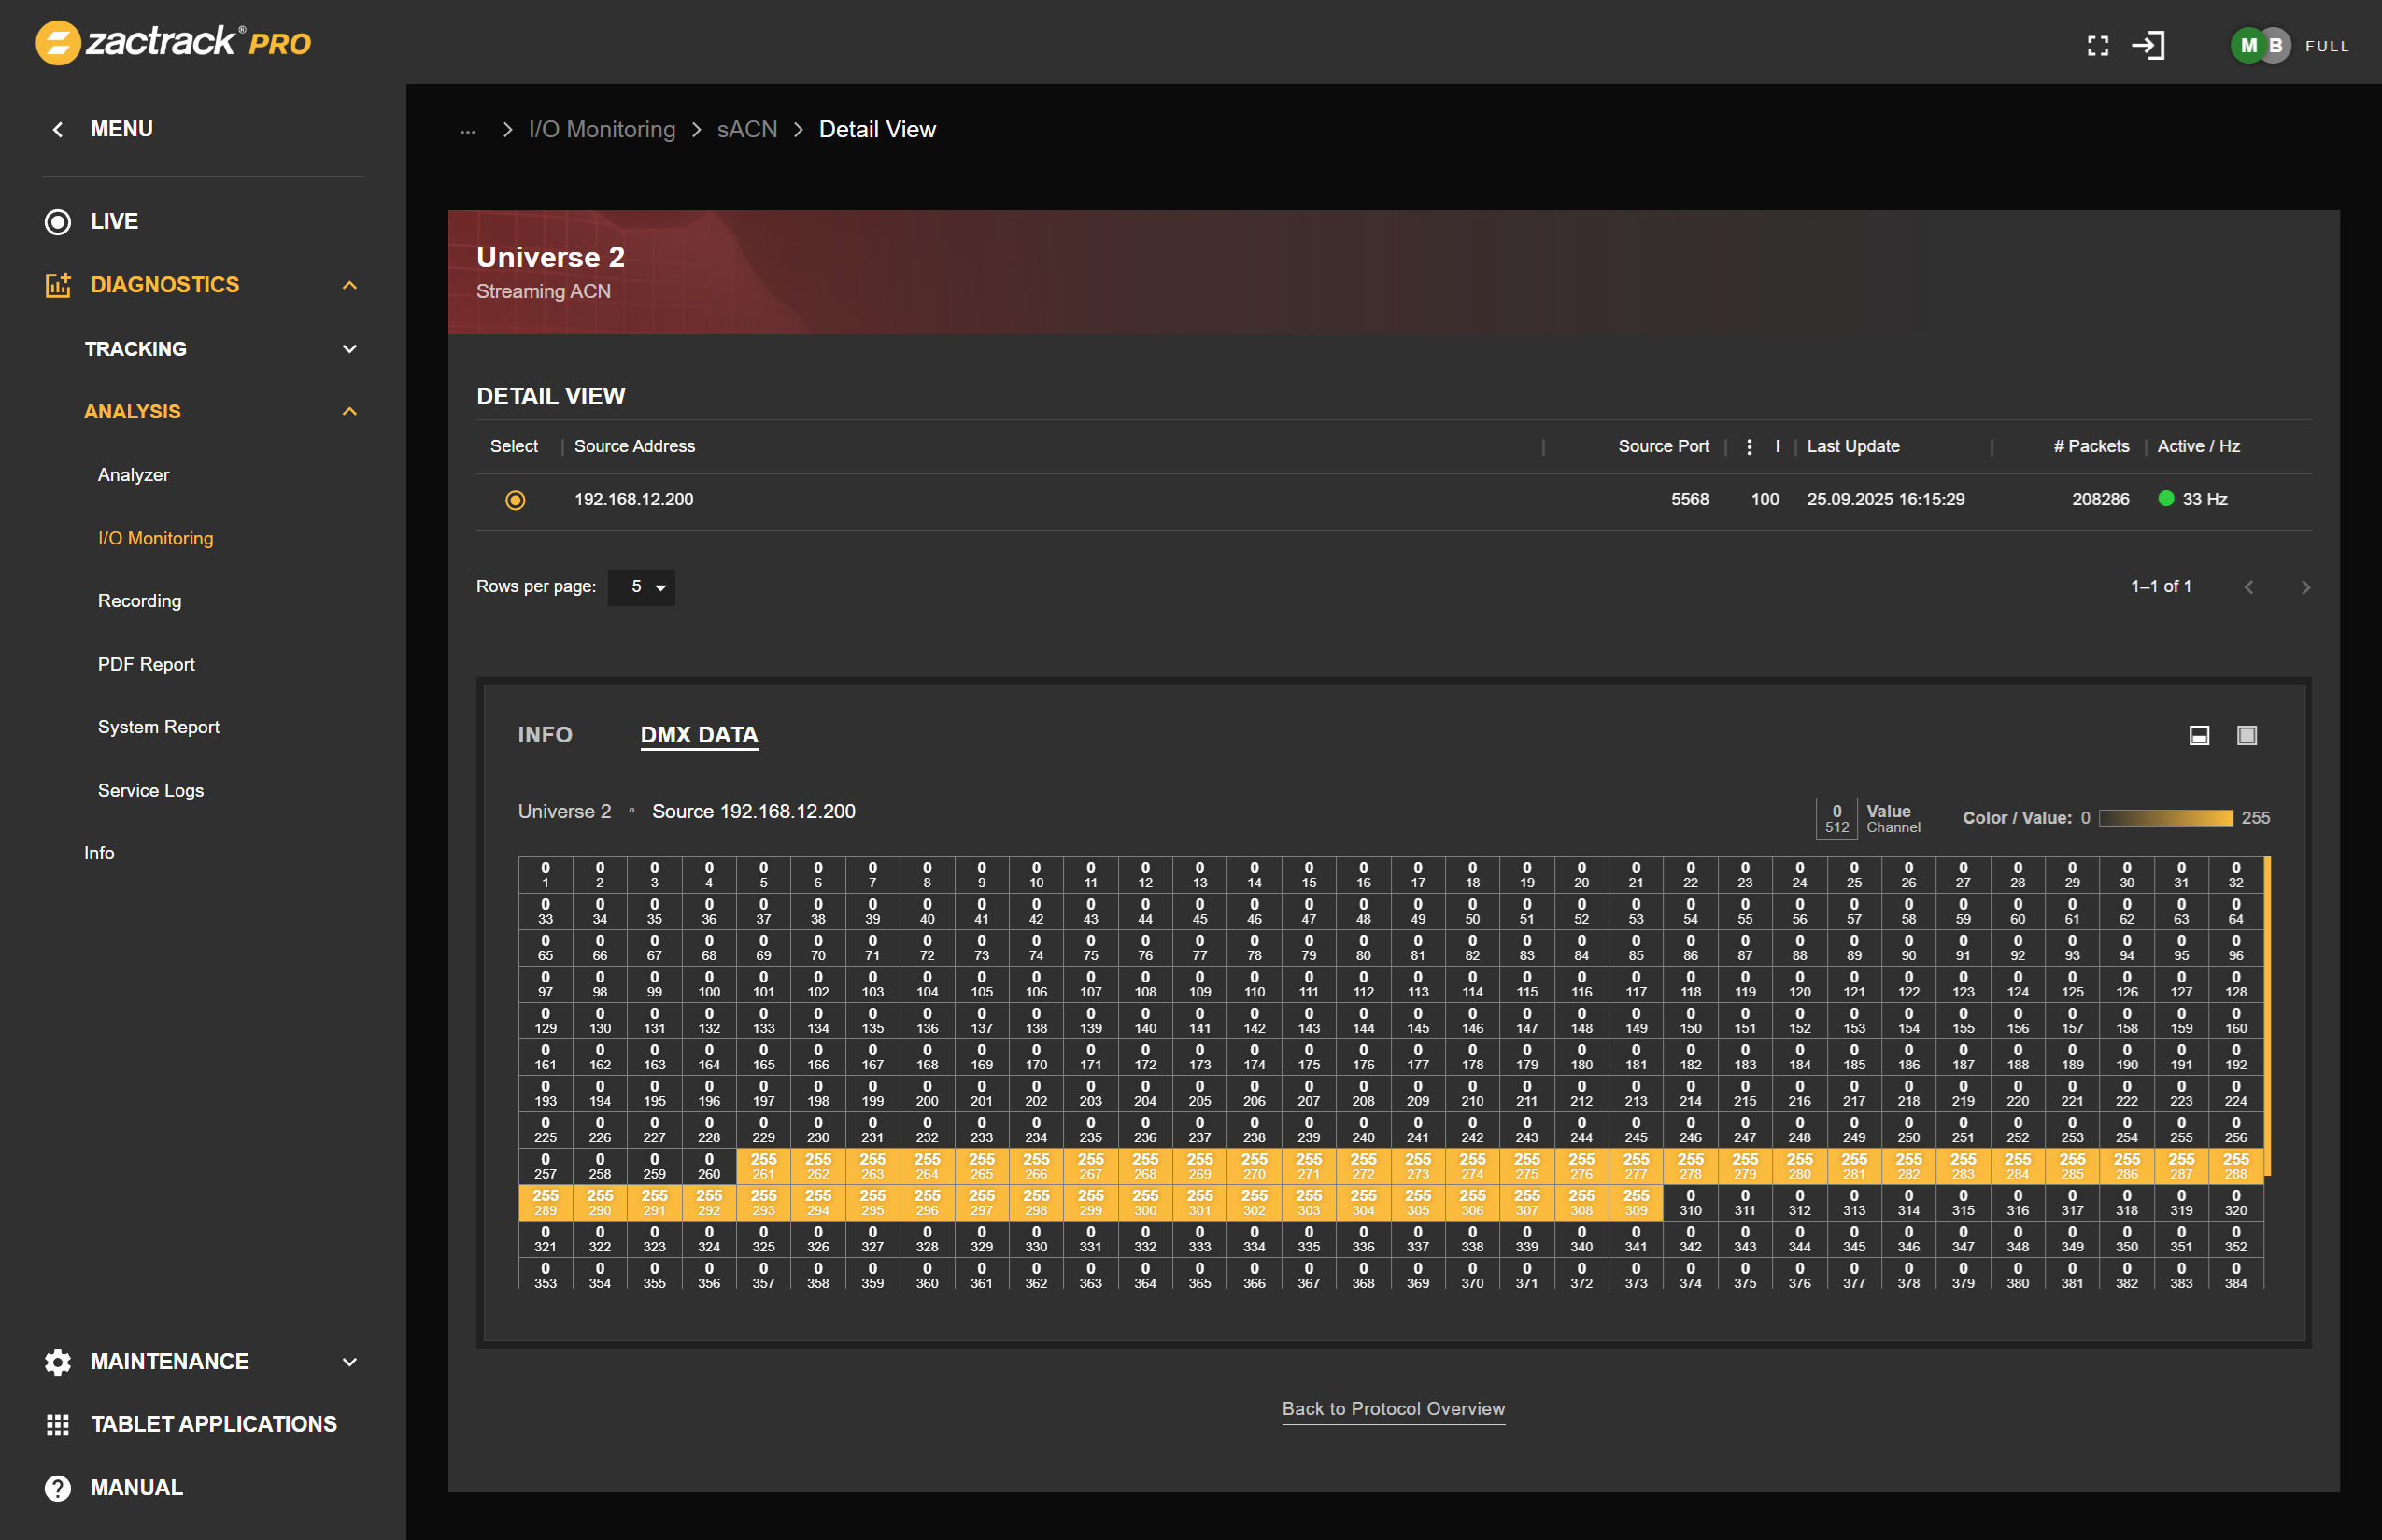 |
On smartphones, the layout is designed in a more compact way with views being organized in a tabbed manner.
 |