zactrack Web Monitor
The Web Monitor is a powerful tool to monitor the zactrack system.
Use the IP adress of the server in any browser to enter the interface.
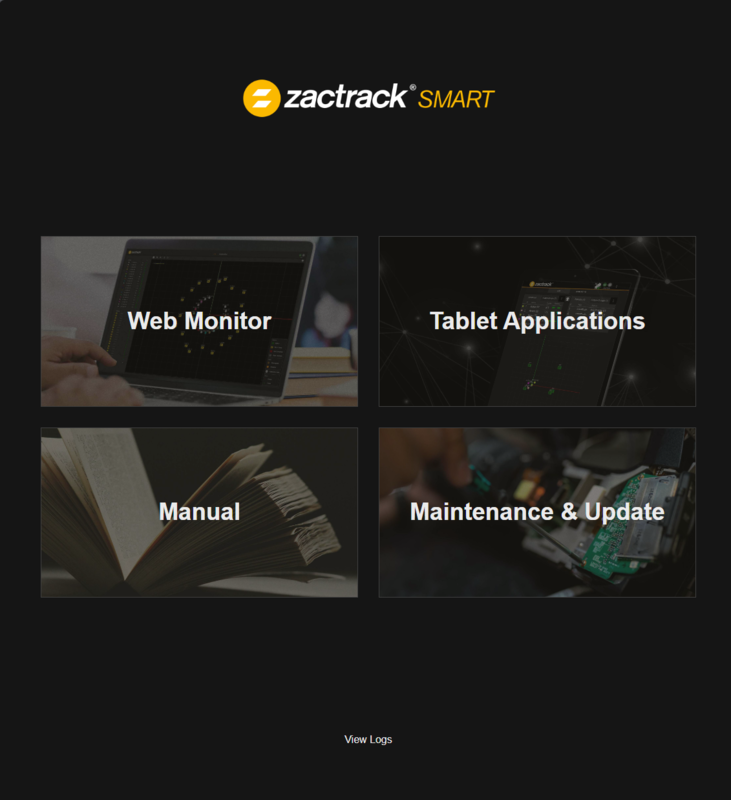 |
Web Monitor
Tool for monitoring the whole zactrack system, and creating reports.
Tablet Applications
Download area for the Tablet Applications to use with an Android device.
Manual
Enter the manual page
Maintenance & Update
Enter for updating and Factory Reset. See Software Update for more information.
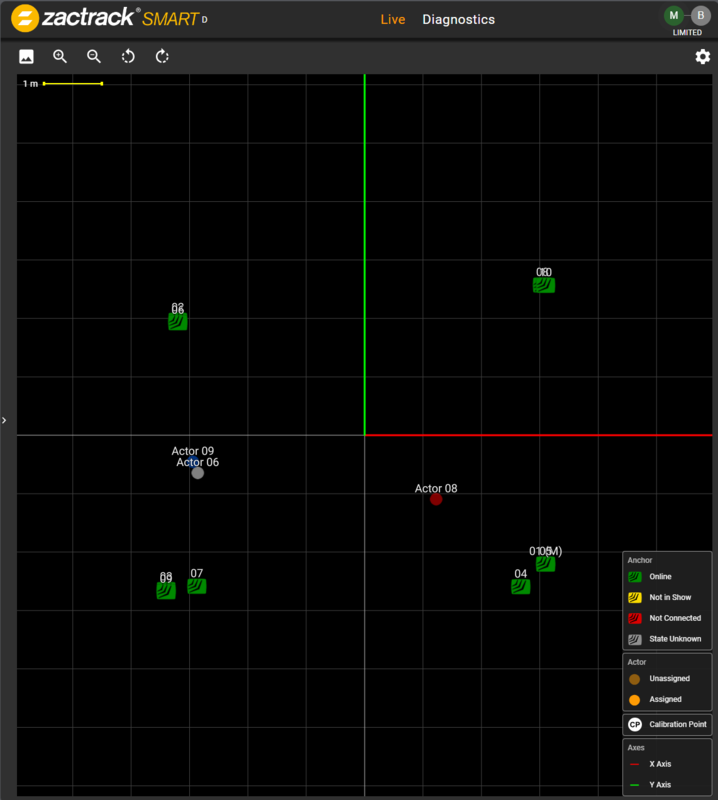
The Web Monitors first section is the Live View. This area contains live position information, status, battery levels and the stage view. The view looks similar to the Live Tab in the zactrack App.
 |
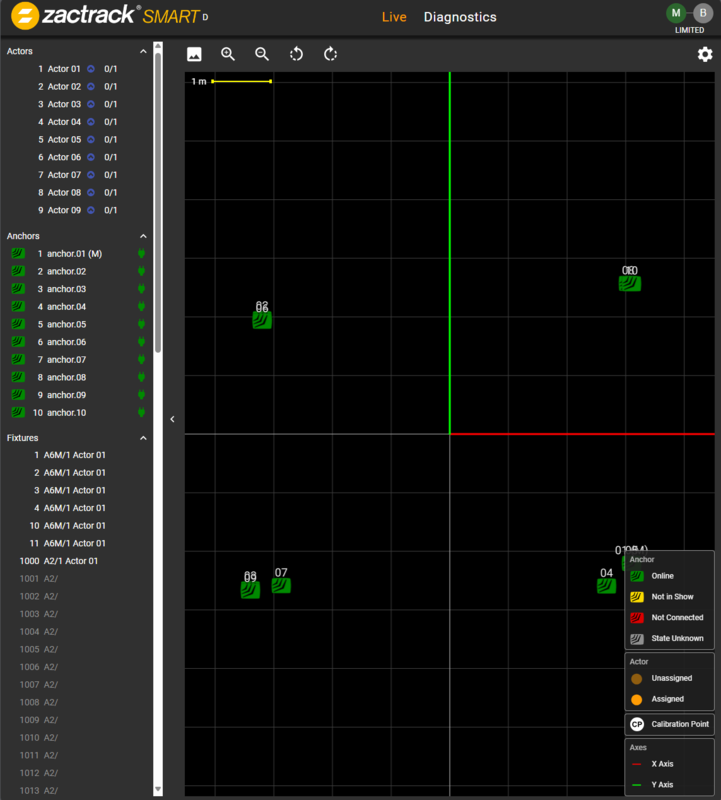
Expand the left side to use all associated Actors and Fixtures.
 |
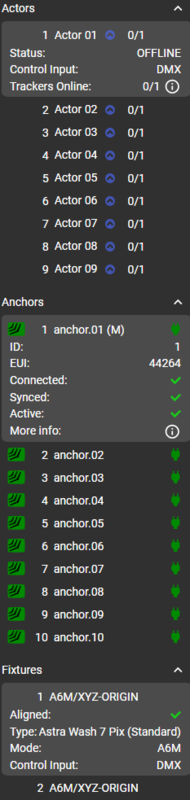
By clicking the device, more information becomes available.
 |
Tap the gear icon in the top right corner to change settings.
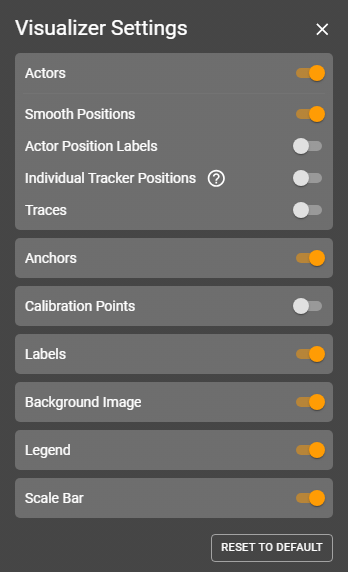 |
Actors
Activate and deactivate Actors View
Smooth Positions
It is poosible to see the raw positions instead of the Smooth Position
Actor Position Labels
See the XYZ coordinates
Individual Tracker Positions
In case of merged Trackers, it is possible to show individual Positions
Traces
A Trace is the historic course of an Actor.
Anchors
Show Anchors
Calibration Points
Show Calibration Points
Labels
Show Labels
Background Image
Show an individual uploaded background image
Legend
Show the Legend
Scale Bar
Show a scale bar
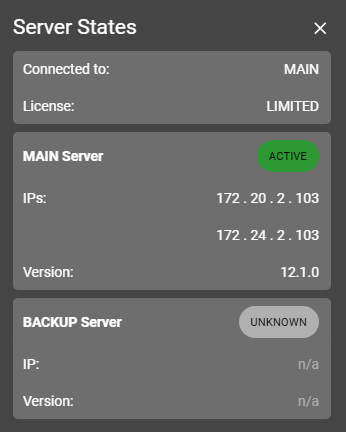
As in the App there is information about Main / Backup by pressing the Main / Backup icon in the top right corner.
 |
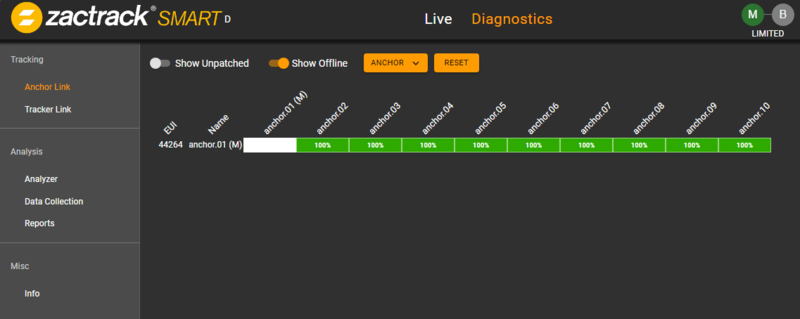
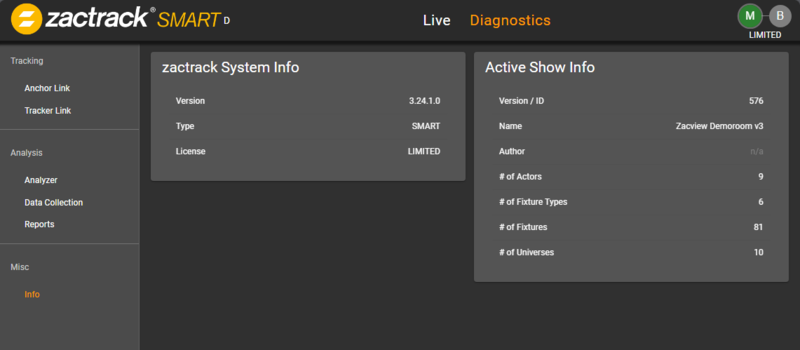
The second tab next to the Live view is the Diagnostics Tab.
Anchor Link
The Anchor Link gives information about the connection between the Anchors.
Tracker Link
The Tracker Link shows information from each tracker to all Anchors.
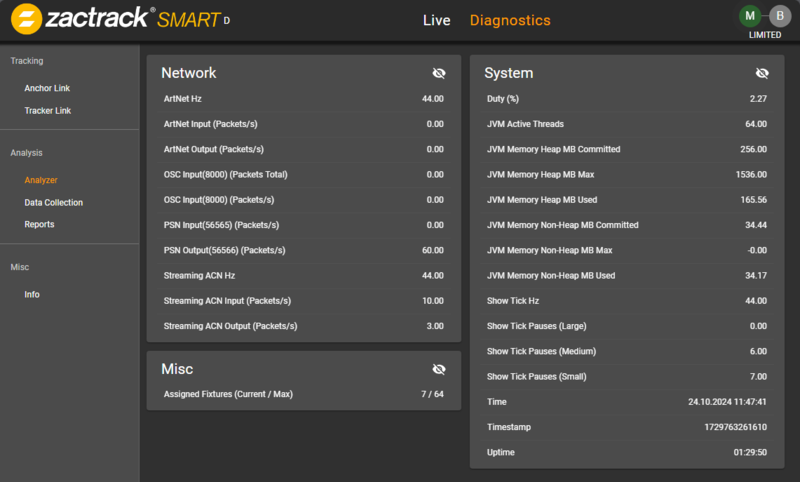
Analyzer
System informations, refresh rates, System load
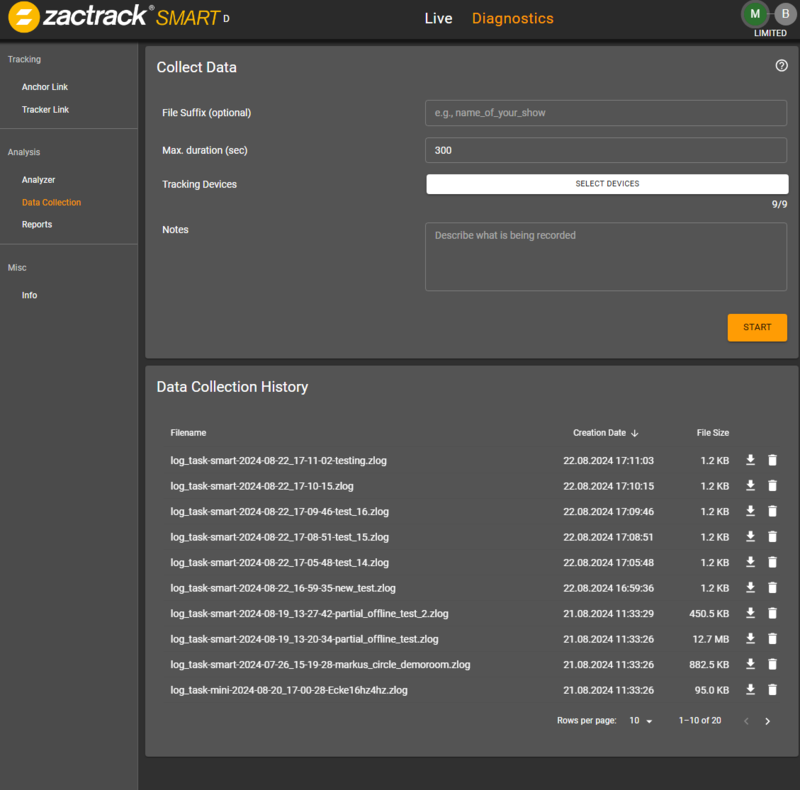
Data Collection
To create a position report it is necessary to first create a data collection. See PDF Report for more information.
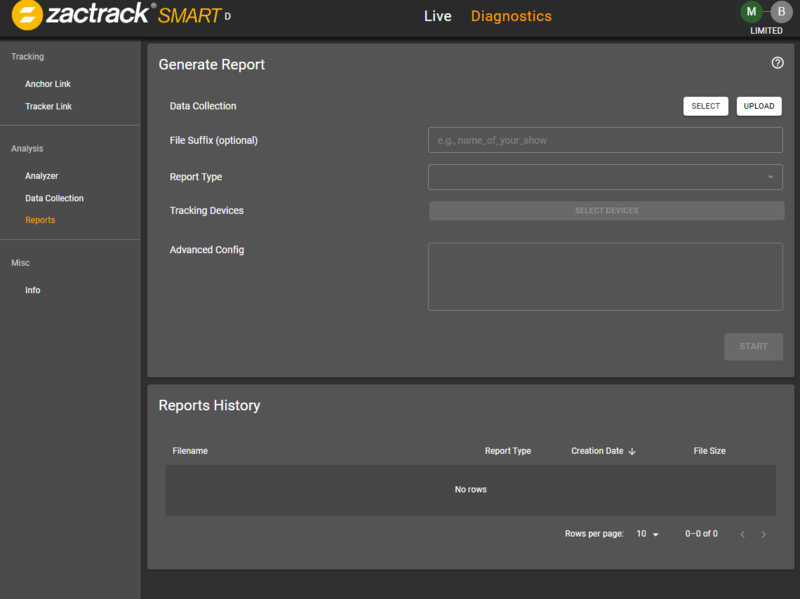
Reports
Generate a PDF Report. See PDF Report for more information.
Warning
Due to the work load, generating a report can cause tracking issues. Don't create a report during a show.
Info
Current version, License, Show Name, etc.
A good way for trouble shooting is creating a PDF Report. This report will collect a complete ranging profile of an Actor. With the generated PDF it is possible to get a better understanding of the system behaviour.
Note
A lot of experience is needed to understand such a report.
Generating a PDF Report
Access the Web Monitor via the IP Adress of the server in a browser.
Note
There are 2 possible Reports: Position Report or Range Report
Data Collection
PDF Generator
Here are some tips for data interpretation.
Range Report
A Range Report collects every single range from Anchor to Tracker. No Position is calculated. This Report helps to see single reflections of an Anchor.
Position Report
A position report creates a lot more data for analysis. See Position Report for more infomation.
This report is always for a single tracker. It is possible to select multiple trackers.
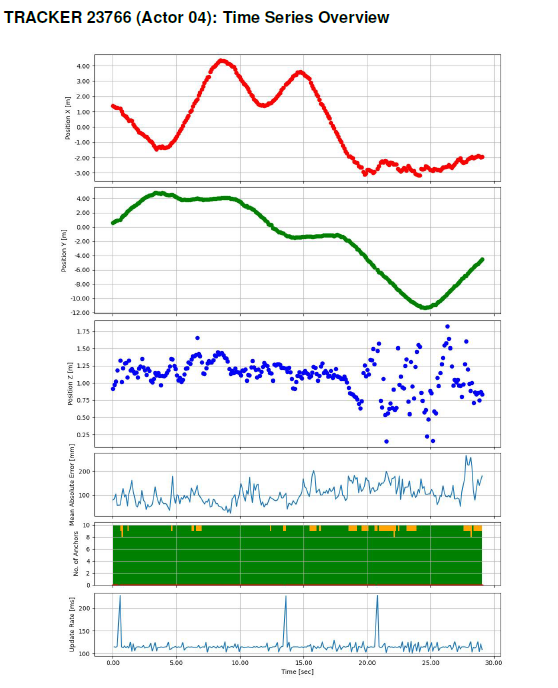
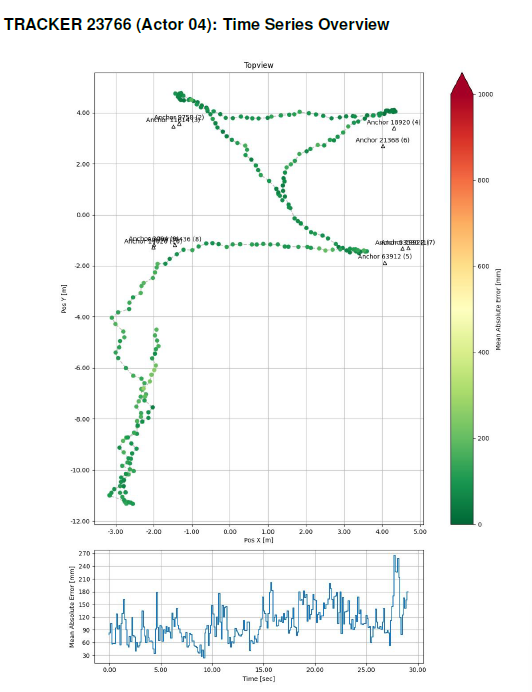
Time Series Overview
Time Series Overview has a complete splitted view of XYZ points. Single points without a course are an indication of bad resolution in an axis. The second diagram shows the complete Path with a Mean Absolute Error.
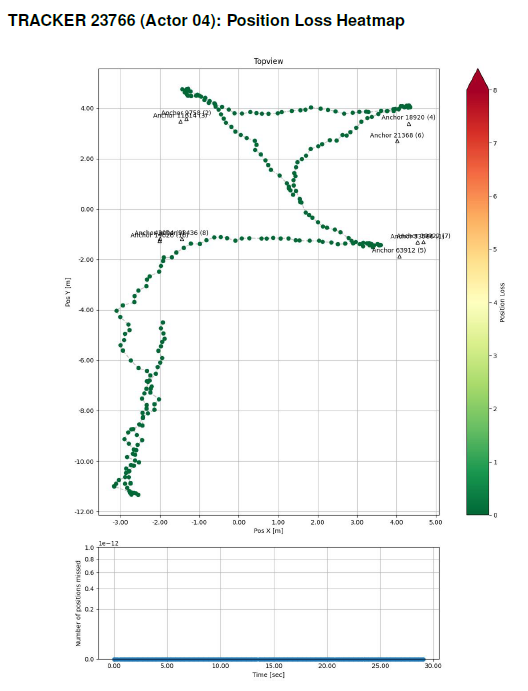
Position Loss Heatmap
This Map shows points with position losses.
Anchor Usage Heatmap
This map shows the used anchors at every single point.
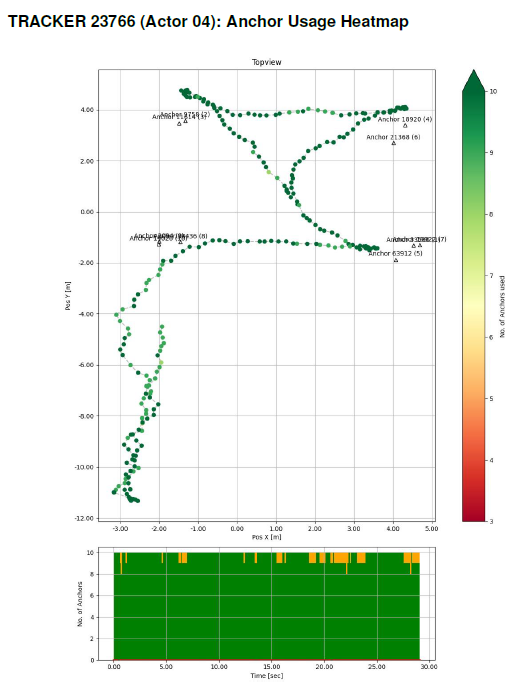
Note
In larger areas and due to the redundance it is possible to not have all anchors at all points.
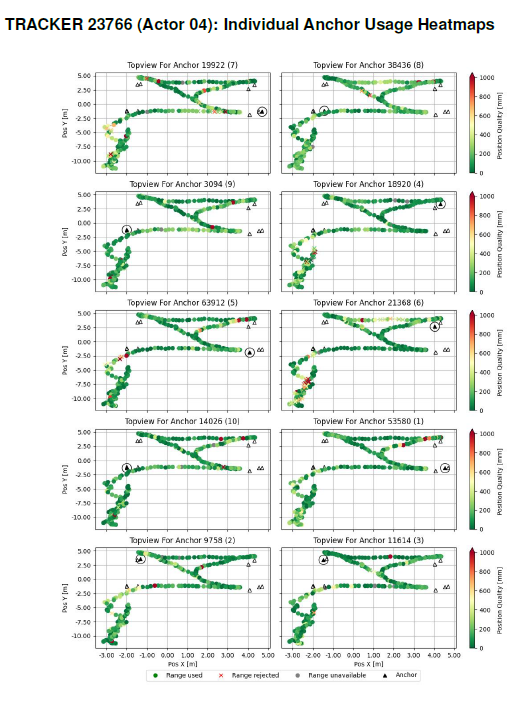
Individual Anchor Usage Heatmaps
This diagram shows a Postion Quality Index for every single Anchor. The used Anchor is highlited in the map.
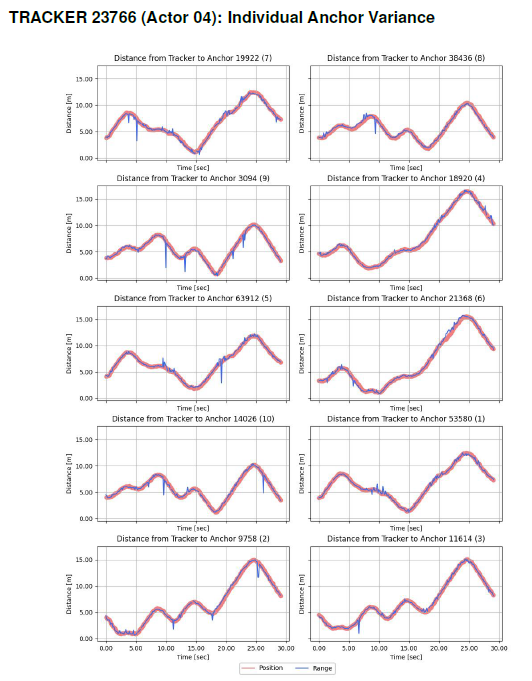
Individual Anchor Variance
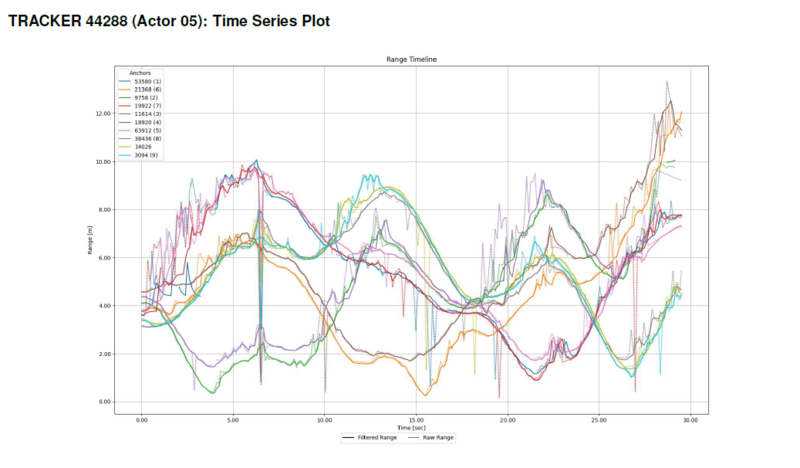
This diagram shows the calculated position in red. A single range from one Anchor is shown in blue. Therefore every single Anchor has one Diagram.
Position Range Report Issue Examples
Here are some examples for obvious issues.
Individual Anchor Variance
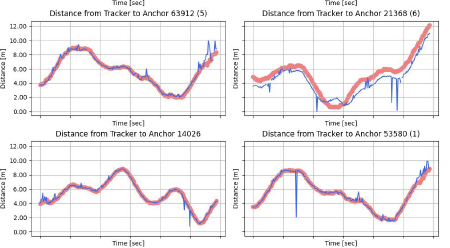
Here is an example of a wrongly measured Anchor. In the top right corner a picture of a shifted blue line is seen. The Anchor collects correct ranges but its own position is wrong. The spikes are reflections.
Individal Anchor Usage Heatmap
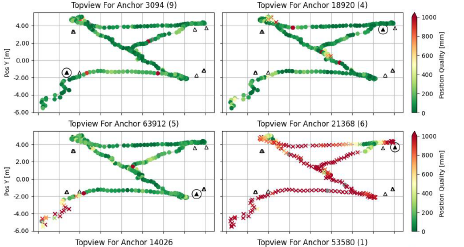
There is a Problem with the Anchor in the bottom row at the right side. The position Quality is noticeably bad. This can be a wrongly measured anchor or a permanent reflection.
Time Series Overview
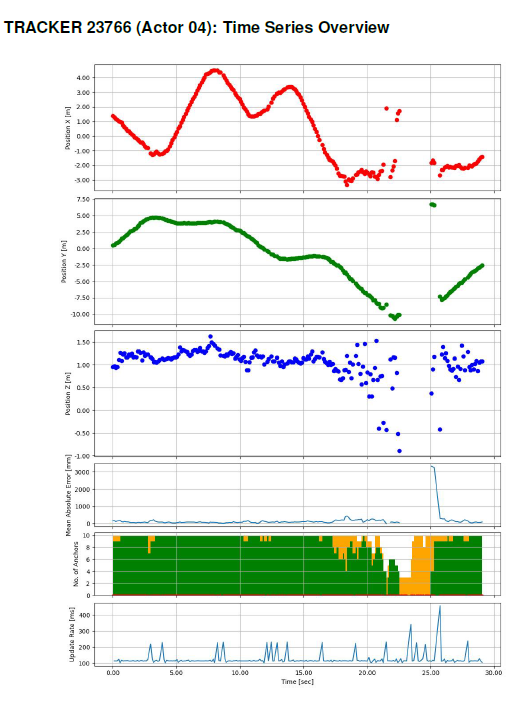
Complete position loss.